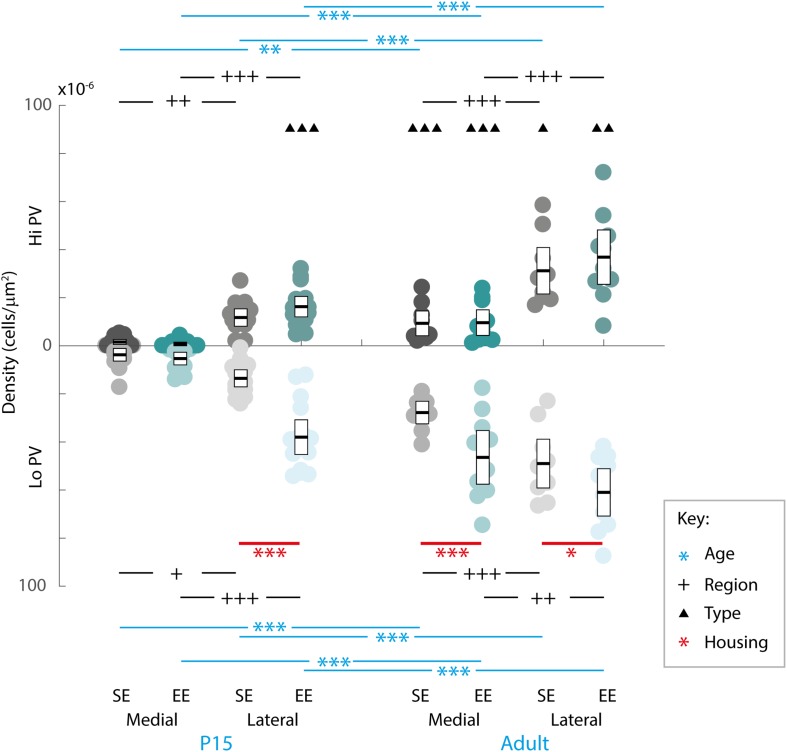
FIGURE 2.
Age, region, cell type as well as housing conditions influence striatal PV expression. Striatal PV cell density (counts per micrometer2) in standard (SE) and enriched (EE) mice at all age points assessed. Blue bars and asterisks (Age): Both Hi PV (above abscissa) and Lo PV (below abscissa) cell densities were significantly greater in adult compared to P15 samples in SE medial (Hi PV: p = 0.001; Lo PV: p < 0.001), lateral (Hi PV: p < 0.001; Lo PV: p < 0.001), as well as EE medial (Hi PV: p < 0.001; Lo PV: p < 0.001) and lateral (Hi PV: p < 0.001; Lo PV: p < 0.001) striatum. Black bars and crosses (Regions): PV positive cell density in the lateral region was significantly higher compared to medial striatum for Hi and Lo PV cells in P15 SE (Hi PV: p = 0.001; Lo PV: p = 0.011), EE (Hi PV: p < 0.001; Lo PV: p < 0.001), as well as adult SE (Hi PV: p < 0.001; Lo PV: p < 0.001) and EE (Hi PV: p < 0.001; Lo PV: p = 0.002) samples. Black triangles (Hi versus Lo PV): While no differences between PV cell types were revealed for either region at P15 for SE mice (p > 0.398, all comparisons), significantly greater Lo PV compared to Hi PV densities were observed in lateral striatum for EE cohorts (p < 0.001). By adulthood, Lo PV densities were significantly higher in both medial and lateral portions of the nucleus for SE (SE medial: p < 0.001; lateral: p = 0.014) as well as EE samples (EE medial: p < 0.001; lateral: p = 0.001). Red bars and asterisks (Housing): At P15, significantly greater Lo PV densities were detected in EE relative to SE samples in lateral striatum (p < 0.001). Lo PV cells continued to exhibit significantly higher densities in both medial (p < 0.001) and lateral (p = 0.049) regions of adult EE sections. No differences in Hi PV densities were observed. Means (solid bar) and standard errors of the mean (s.e.m.; extent of white boxes) are depicted. Individual values are depicted as coloured circles: darker greys: medial SE; darker cyans: medial EE; lighter greys: lateral SE; Lighter cyans: lateral EE. ∗p < 0.05; ∗∗p < 0.01; ∗∗∗p < 0.001; + p < 0.05; ++p < 0.01; +++p < 0.001; ▲p < 0.05; ▲▲p < 0.01; ▲▲▲p < 0.001. Key indicates parameter over which significance was found.

