FIGURE 3.

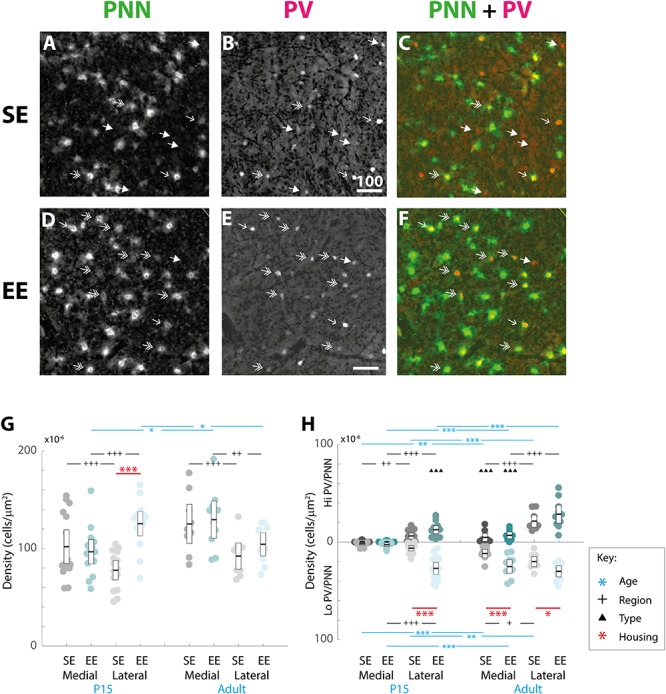
Age, region, cell type, and housing conditions affect PNN and PV/PNN overlap differently in the developing and adult striatum. (A–F) Images showing the pattern of PNN (WFA) staining (A,C), PV expression (B,E), and their overlap (C,F) in the lateral striatum of adult mice raised in standard (SE; top row) and enriched (EE: bottom row) housing. Both Hi PV (single-headed, unfilled arrows) and Lo PV (double headed arrows) cells are detectable in SE and EE samples. Unlike in cortex, only a partial overlap between PV cells and PNNs is observed in the striatum. Filled arrows indicate PV-positive cells that are not encapsulated by PNNs. Overall, PV cell density appears to have increased in the EE section (compare E to B), while little or no difference is observable for PNNs (compare D to A). Scale bar (in image): 100 μm. (G) Striatal PNN density (counts per micrometer2) in standard (SE) and enriched (EE) mice at all ages assessed. Conventions are identical to those in Figure 2. Blue bars and asterisks (Age): No differences in PNN densities by age were revealed in either region for SE samples (SE by age, p > 0.07 for medial and lateral domains). A significant increase in adult compared to P15 PNN levels was, however, detected in medial striatum in EE mice (Adult > P15: p = 0.010). Curiously, lateral densities exhibited a significant decrease with age in this cohort (P15 > Adult: p = 0.019). Black bars and crosses (Regions): Significant differences were observed between striatal regions, with medial densities greater than lateral for P15 SE samples (Medial > Lateral, p < 0.001). EE pups exhibited the opposite bias at this age point (Lateral > Medial, p < 0.001). For adult samples, both SE (p < 0.001) and EE (p = 0.002) groups exhibited greater medial PNN densities. Red bars and asterisks (Housing): At P15, significantly greater PNN densities were detected in EE relative to SE samples in lateral striatum (p < 0.001). Differences between housing groups, however, were not maintained in adult samples for either striatal region. Means (solid bar) and standard errors of the mean (s.e.m.; extent of white boxes) are depicted. Individual values are depicted as coloured circles: darker greys: medial SE; darker cyans: medial EE; lighter greys: lateral SE; lighter cyans: lateral EE. ∗p < 0.05; ∗∗p < 0.01; ∗∗∗p < 0.001; +p < 0.05; ++p < 0.01; +++p < 0.001. (H) Density (counts per micrometer2) of PV/PNN overlap in SE and EE mice at all age points assessed. Blue bars and asterisks (Age): Across ages, overlap with both Hi (Medial: p = 0.005; Lateral: p < 0.001) and Lo PV cells (Medial: p < 0.001; Lateral: p = 0.001) were significantly greater in adults compared to P15 mice, in both medial and lateral striatum for SE cohorts. In EE mice, both Hi PV/PNN (EE: Hi PV/PNN: p < 0.001) and Lo PV/PNN (Lo PV/PNN: Adults > P15, p < 0.001) overlap was significantly higher in adults compared to P15 samples in medial striatum. Significantly greater densities were also detected for adult Hi PV/PNN (p < 0.001) but not Lo PV/PNN (p = 0.403) associations in the lateral region. Black bars and crosses (Regions): Overlap in lateral compared to medial regions was significantly higher for Hi PV cells in both SE (p = 0.009) and EE samples (p < 0.001). Overlap densities in lateral striatum were greater for Lo PV cells only in EE samples at the same age (p < 0.001). A similar trend was observed in adult samples, with greater Hi PV/PNN associations detected in lateral compared to medial striatum for SE (p < 0.001) and EE (p < 0.001) groups. Regional differences in (Lo PV/PNN overlap densities were detected in SE (Lateral > Medial: p = 0.018) but not EE mice (p = 0.124). Black triangles (Cell Types): No cell type differences between Hi and Lo PV/PNN overlap were revealed at P15 for SE striatum (p > 0.36). In EE samples, however, significantly greater Lo PV/PNN compared to Hi PV/PNN associations were observed in lateral (p < 0.001), but not medial (p = 0.088) striatum at this age. In adulthood, Lo PV/PNN overlap was detectably higher in medial, but not lateral portions of the nucleus for both SE and EE groups (Adult SE Medial, Lo PV/PNN > Hi PV/PNN: p < 0.001; EE Medial, Lo PV/PNN > Hi PV/PNN: p < 0.001; no differences in lateral striatum for either housing group at this age: p > 0.73). Red bars and asterisks (Housing): Significantly greater Lo PV/PNN (p < 0.001; black asterisks) overlap densities were detected in EE relative to SE samples in lateral striatum at P15. PV/PNN overlap exhibited significantly higher densities in both medial (p < 0.001; black asterisks) and lateral (p = 0.019; black asterisks) regions of EE sections in adults. No differences in Hi PV/PNN densities were observed. Means (solid bar) and standard errors of the mean (s.e.m.; extent of white boxes) are depicted. Conventions are identical to Figure 2. ∗p < 0.05; ∗∗p < 0.01; ∗∗∗p < 0.001; +p < 0.05; ++p < 0.01; +++p < 0.001; ▲p < 0.05; ▲▲p < 0.01; ▲▲▲p < 0.001.)
