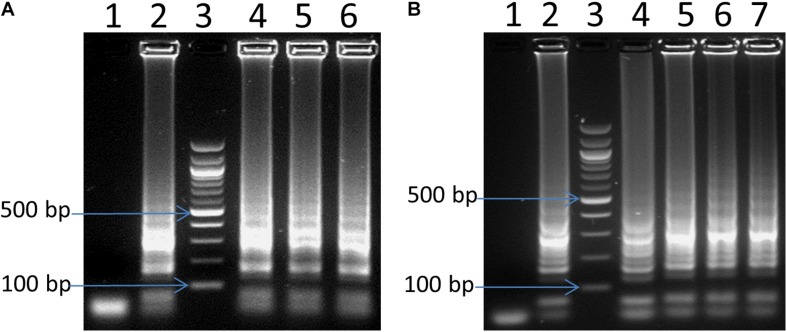
FIGURE 2.
Optimization of LAMP for reaction volume (A) and amplification time (B). In panel (A), lane 4, 5 and 6: 6, 12.5, and 25 μL reaction volume, respectively. In panel (B), lane 4, 5, 6 and 7: 15 min, 30 min, 45 and 60 min, respectively. In both panels (A,B): lane 1: negative control, lane 2: positive control, and lane 3: 100 bp ladder.

