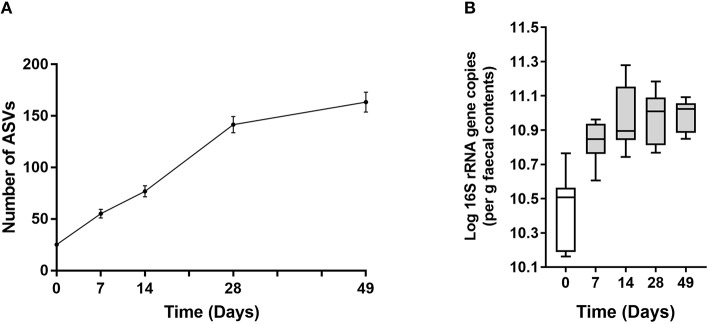
Figure 3.
(A) Line plot showing increase in number of ASVs over time. Values are mean ± SEM. (B) Total 16S rRNA gene copy number in fecal samples over time. Boxplots display the median as the middle line whilst the perimeters of the box display the 1st and 3rd quantiles of the data. The whiskers extend to the highest and lowest values. Gray bars indicate significance (p < 0.001) compared with day 0.

