
Fig. 6.
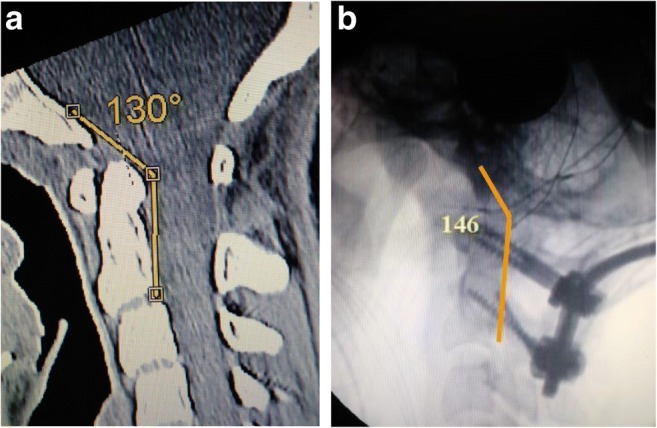
Intraoperative reduction: the preoperative CT (i) shows a CXA of 130°; the intra-operative fluoroscopic image after reduction (ii) shows a CXA of 146°
Official websites use .gov
A
.gov website belongs to an official
government organization in the United States.
Secure .gov websites use HTTPS
A lock (
) or https:// means you've safely
connected to the .gov website. Share sensitive
information only on official, secure websites.
Intraoperative reduction: the preoperative CT (i) shows a CXA of 130°; the intra-operative fluoroscopic image after reduction (ii) shows a CXA of 146°