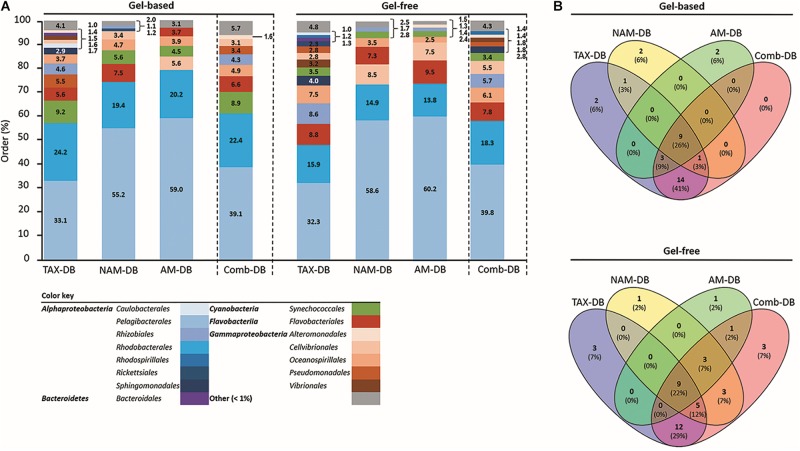
FIGURE 2.
(A) Relative taxonomic composition at order level for each methodology. Values represent the proportion of proteins with identical taxonomy on total identified protein using TAX-DB, NAM-DB, AM-DB, or Comb-DB in both gel-free and gel-based approaches. The number of peptides detected for each protein was used as quantitative value. Taxa displaying a proportion <1% were gathered into “Other” category. (B) Venn diagrams showing the number of common and unique taxa identified at order level.

