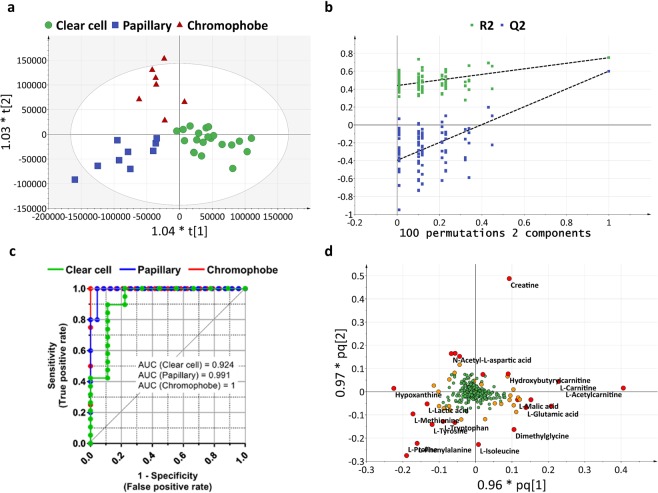
Figure 1.
Renal cell carcinoma subtype classification based on untargeted metabolomics data. (a) OPLS-DA model of RCC subtype classification (N = 37). The model is composed of 2 predictive components and 1 orthogonal component and presents an R2X(cum) of 44.2%, a goodness-of-fit R2 of 75.0%, a goodness-of-prediction Q2 of 59.7% and a CV-ANOVA p-value of 7.516 × 10⁻⁸. (b) Validation plot obtained from 100 permutation tests. (c) ROC (Receiver Operating Characteristic) curves obtained from an independent cohort (N = 28) showing the ability of OPLS-DA model to predict RCC subtypes. (d) Loading plot showing the most discriminative metabolites. The metabolites with VIP (Variable Importance for the Projection) >3 are highlighted with red circles; with VIP >2 are highlighted with orange circles. Variables with VIP >3 are used for further pathway analysis.

