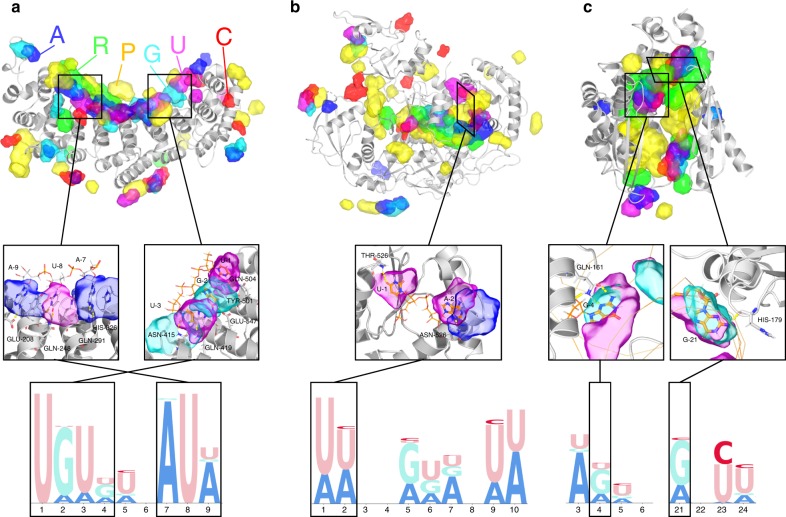
Fig. 3.
NucleicNet prediction captures detailed binding motion determined by structural biology experiments. a FBF2, b hAgo2, and c Aa-RNase III. Upper panel: NucleicNet predictions for query RBPs. Top 10% of the binding sites are drawn in transparent surfaces for each class. Color code: phosphate-yellow, ribose-green, adenine-blue, cytosine-red, guanine-cyan, uracil-purple, and protein-gray cartoon. Middle panel: detailed view on chemical interactions. Lower panel: predicted sequence logo diagrams for respective RBPs

