Figure 4.
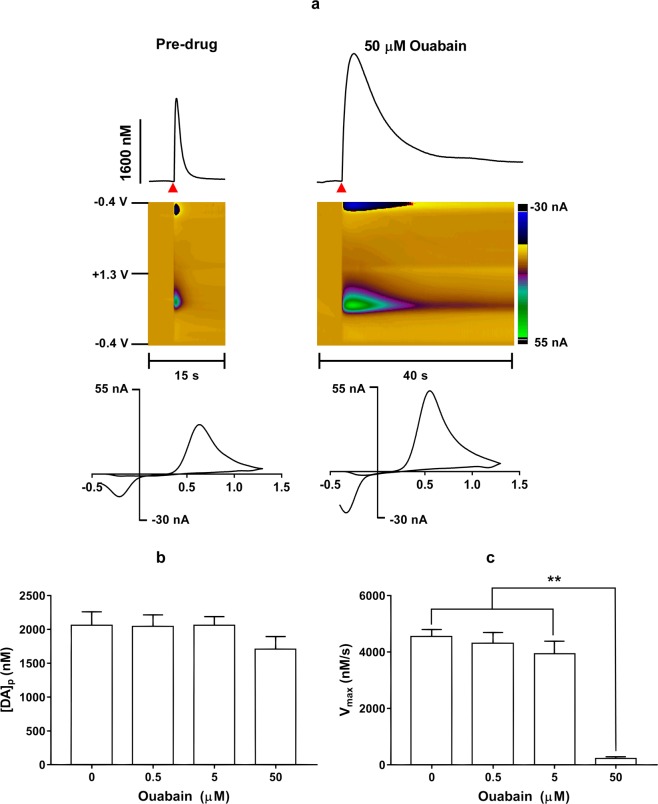
(a) Representative traces (top) with their respective false color plots (middle) and voltammograms (bottom) of electrically-evoked DA in the mouse dorsolateral striatum taken before (left) and 20 min after (right) ouabain (50 μM) perfusion. These signals had oxidation and reduction peaks at +0.6 V and −0.2 V, respectively, identifying the measured species as DA. The false color plots depict the voltammetric data, with time on the x-axis, applied scan potential on the y-axis, and background-subtracted faradaic current shown on the z-axis in pseudo-color. The red triangle indicates an electrical stimulation. Twenty minutes after administration, ouabain did not have a significant effect on DA release per stimulus pulse at any concentration (b) but did significantly reduce DA uptake (c), measured as the Vmax, at the highest concentration (50 μM) but not lower concentrations (0.5 μM and 5 μM). Data are presented as means ± SEM of 5 mice. **p < 0.01.

