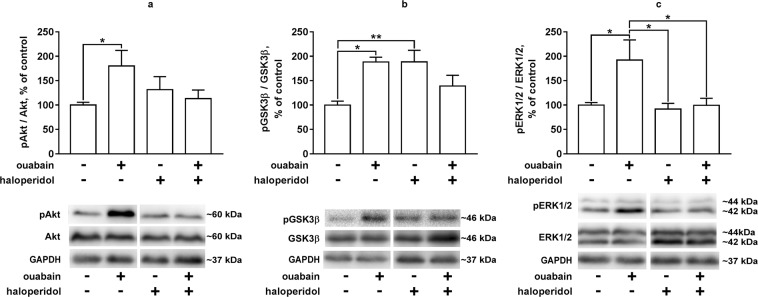
Figure 6.
Akt, GSK3β and ERK1/2 activation in the striatum of mice under combined or separate administration of ouabain and haloperidol. Akt (a), GSK3β (b) and ERK1/2 (c) phosphorylation in the striatal tissue of mice under combined or separate administration of ouabain (ICV, 50 µM, 0.5 µl bilaterally) and haloperidol (intraperitoneal, 70 µg/kg, 30 min prior to the ICV injection) 30 min after ouabain administration. Results are presented as mean ± SEM, N = 8 per group; **p < 0.01, ***p < 0.001 according to two-way ANOVA with Tukey’s multiple comparisons test. Representative bands are combined: control + ouabain and haloperidol + ouabain-haloperidol (for full set of the bands see Supplementary Fig. S8).

