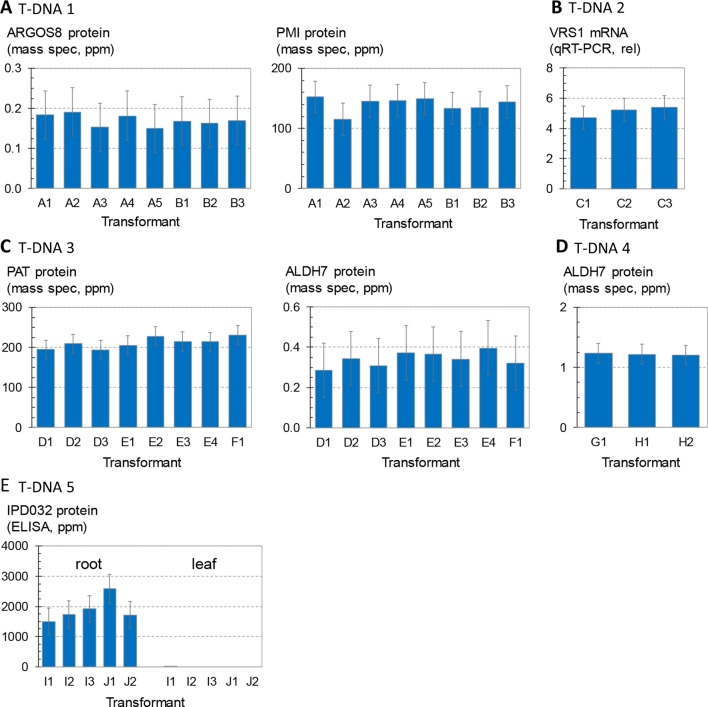
Figure 2.
Analysis of transgene expression levels from T-DNA insertions in maize. Transformant names (x axis) indicate independent transformation experiments (large case letter) and independent insertion events from the same transformation experiment (number). For example, the data in (A) are from five independent transformants or events from experiment A and three independent transformants or events from experiment B. (A) and three independent transformants or events from experiment B. Each bar is the average of four replicates of three to four plants each, and error bars indicate 95% confidence intervals. Results from 447 plants are summarized. (A) Concentrations of ARGOS8 and PMI in leaf extracts of plants containing T-DNA 1. Each bar is the mean of 14–16 plants. (B) Concentrations of VRS1 transcripts in leaf extracts of plants containing T-DNA 2. Each bar is the mean of 15–16 plants. (C) Concentrations of PAT and ALDH7 in leaf extracts of plants containing T-DNA 3. Each bar is the mean of 15–16 plants. (D) Concentrations of ALDH7 in leaf extracts of plants containing T-DNA 4. Each bar is the mean of 15–16 plants. (E) Concentrations of IPD032 in root and leaf extracts of plants containing T-DNA 5. Each bar is the mean of 14–18 plants. For events containing the IPD032 transgene, each replicate consisted of two to five plants hemizygous for the IPD032 transgene.

