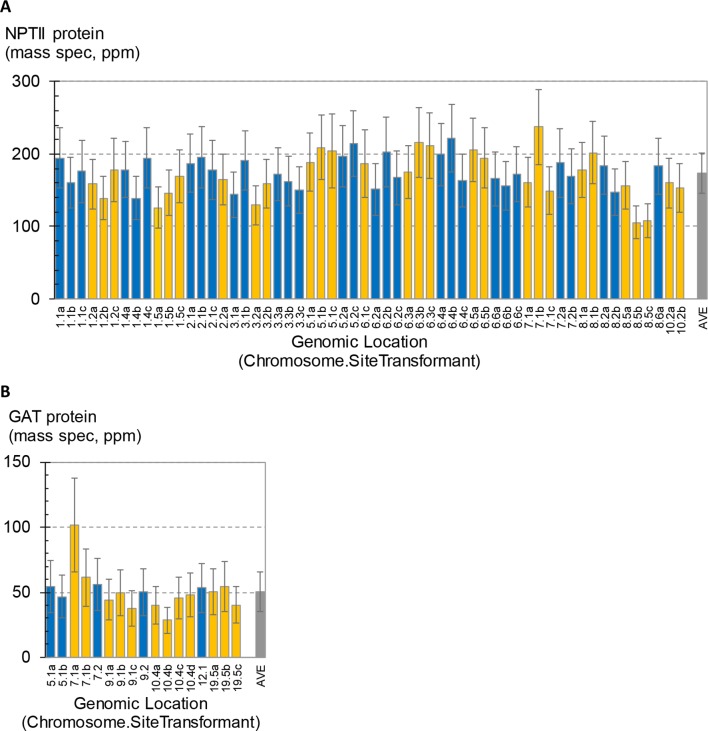
Figure 4.
Measurement of transgene expression levels in transformants generated by site-specific integration (SSI). One to four independent SSI events were characterized at each genomic insertion site. The x-axis labels indicate the chromosome number followed by site number (arbitrary) and ending with a small case letter to identify independent events at the same site (a–d). Error bars on blue and gold bars indicate 95% confidence intervals. Gray bars indicate average ± standard deviation of all events. (A) Concentrations of NPTII protein in leaf extracts from 58 independent maize transformants were measured by mass spectrometry. Results from 840 plants are summarized; each bar is the mean of 10–16 plants. (B) Concentrations of GAT protein in leaf extracts from 17 independent soybean SSI transformants. Results from 167 plants are summarized; each bar is the mean of 9–10 plants.

