
FIGURE 1.
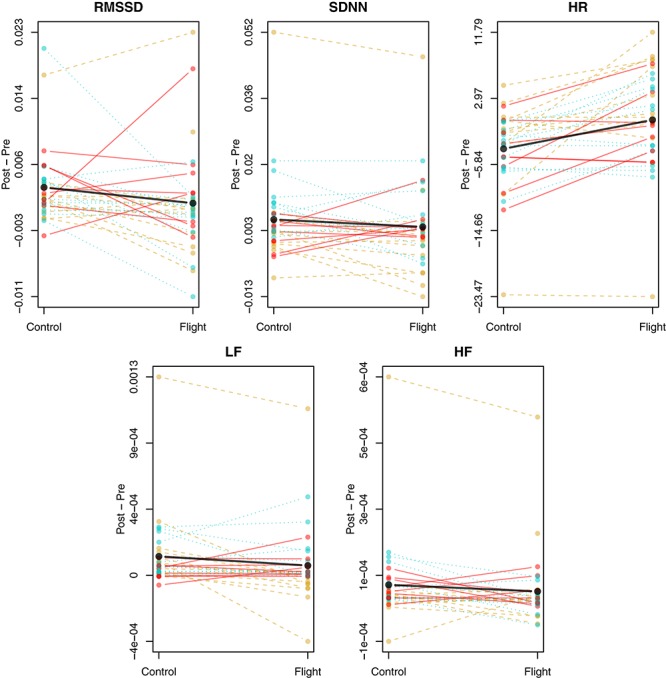
Unadjusted, average difference between pre-condition and post for heart rate (HR) and HRV (RMSSD, SDNN, HF, and LF) broken down by simulated flight and control day for each subject. The differences are first averaged over all available measurements for each subject’s control and flight days. Solid red lines and points denote each Heart Failure participant’s mean difference for a given day, dashed gold lines and points denote Healthy participants, and dotted cyan lines and points denote the Smokers. Solid black lines and points denote the mean value across all differences on the given day.