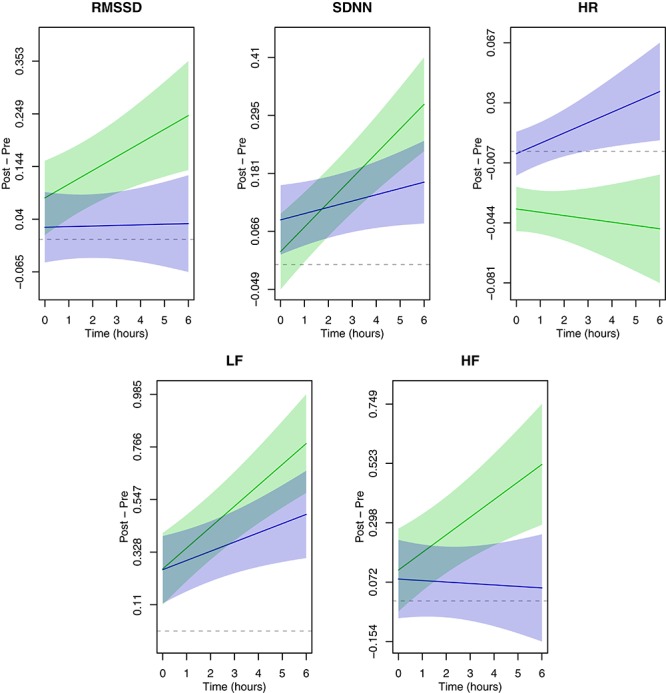
FIGURE 2.

Time-varying associations between simulated flight exposure and heart rate (HR) and HRV (RMSSD, SDNN, HF, and LF). The simulated flight day is in blue; the control day is in green. Solid color lines indicate the average effect of exposure over time while the shaded bands are 95% confidence intervals for the corresponding line. Dashed gray lines are placed at zero for reference. Plotted estimates represent the changes from pre-condition for log(HR) and log(HRV) as a function of duration.
