Fig. 5.
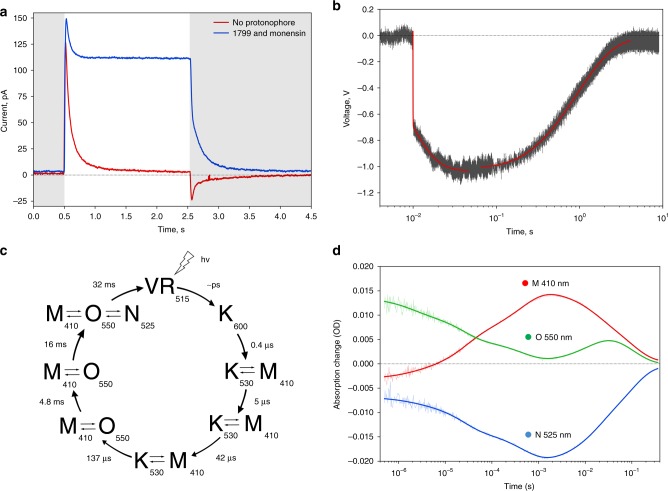
Functional characterization of OLPVRII. a BLM measurements of OLPVRII in E. coli polar lipid liposomes. Red curve shows the electrical signal on BLM under illumination without addition of protonophore, while blue curve represents the signal under the same conditions, but after addition of 1799 and monensin. Illumination onset is indicated by gray (light off) and white (light on) colors. b Time-resolved BLM experiment. Electrical signal (gray) was recorded after laser flash and fitted with the exponential decay curves (red). c Schematic representation of photocycle kinetics of the OLPVRII reconstituted into soybean liposomes. Lifetimes and absorption maxima of the intermediate states are indicated. d Time traces of the absorption changes of OLPVRII measured at 410, 525, and 550 nm. Source data are provided as a Source Data file

