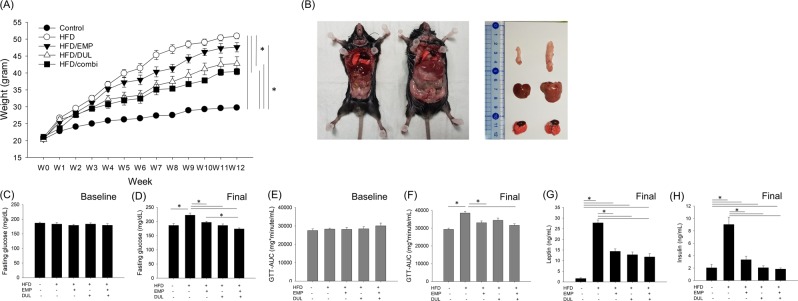
Figure 1.
We designed 5 groups as follows: normal diet control (n = 6), HFD-induced obesity (n = 7), HFD/EMP (n = 5), HFD/DUL (n = 7), and HFD/combi (n = 7). Weight changes among groups (A), gross appearance and volume of internal organ in control group (left) and HFD group (right) (B), baseline fasting glucose level among groups at week 0 (C), fasting glucose level among groups at week 12 (D), baseline GTT-AUC among groups at week 0 (E), GTT-AUC among groups at week 12 (F), serum level of leptin (G) and insulin (H) among groups at week 12. Repeated-measures analysis of variance (ANOVA) followed by a post-hoc Bonferroni test was used in Fig. 2A and one-way ANOVA followed by a post-hoc Bonferroni test was used in Fig. 2C-F. HFD, high-fat diet; EMP, empagliflozin; DUL, dulaglutide; combi, combination of EMP and DUL; GTT, glucose tolerance test; AUC, area under the curve.

