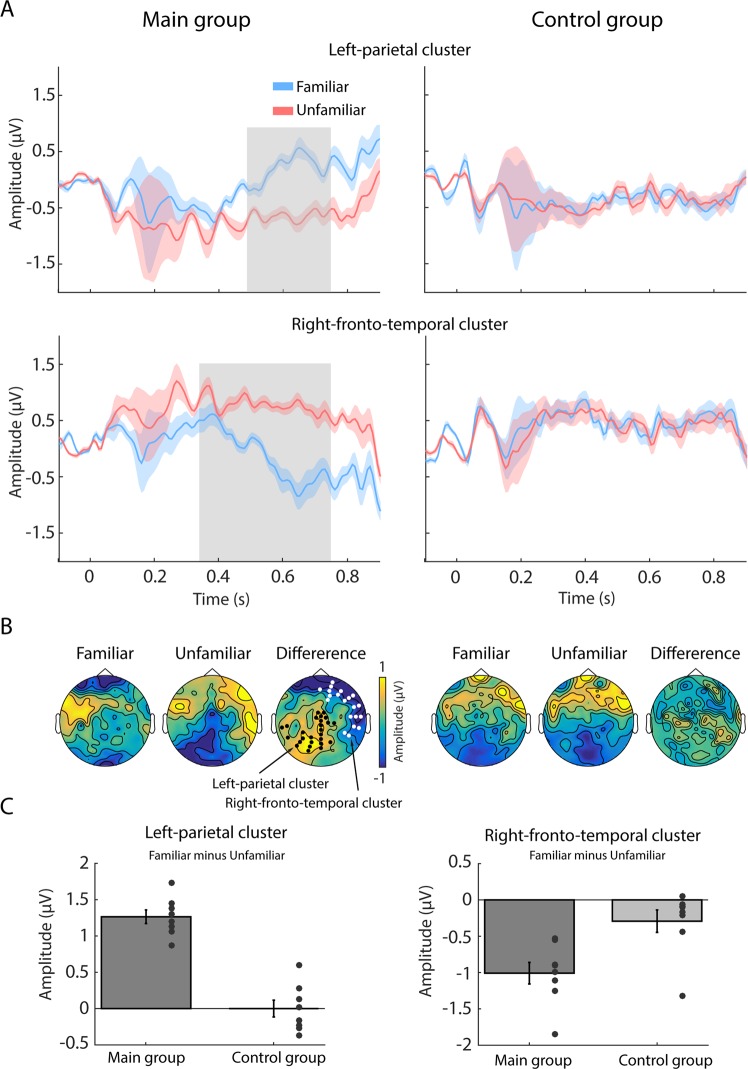
Figure 2.
Event-related potential results – differences between “familiar” and “unfamiliar” snippets in the main, but not control, group. (A) Time-domain ERPs for the left-parietal cluster (top row) and right frontotemporal cluster (bottom row), separately for the main (left column) and control (right column) group. Solid lines represent mean data (averaged across channels and dyads) for familiar (blue) and unfamiliar (red) songs (note that this labelling only applies to the ‘main’ group; both songs were unfamiliar to the control listeners). Significant differences between conditions, as obtained via cluster-based permutation tests, are indicated by grey boxes. Note that the shaded areas reflect standard error of the mean for each condition, whilst the reported statistics are conducted as a repeated measures analysis. (B) Topographical maps of the “familiar” and “unfamiliar” ERP responses (computed from 350 to 750 ms) as well as their difference, separately for the main (left column) and control (right column) group. Black and white dots indicate electrodes belonging to the left-parietal and right frontotemporal cluster, respectively. (C) Mean ERP amplitude differences. The main group, but not the control group, showed significantly larger responses to unfamiliar song snippets, at both the left-parietal and the right frontotemporal clusters. Error bars represent standard error of the mean, dots represent mean response differences (across participants) to each song (8 “familiar” and 8 matched “unfamiliar” songs). In the main group, each dot reflects data from a single subject. In the control group, each dot reflects the average across the 12 members of the control group.

