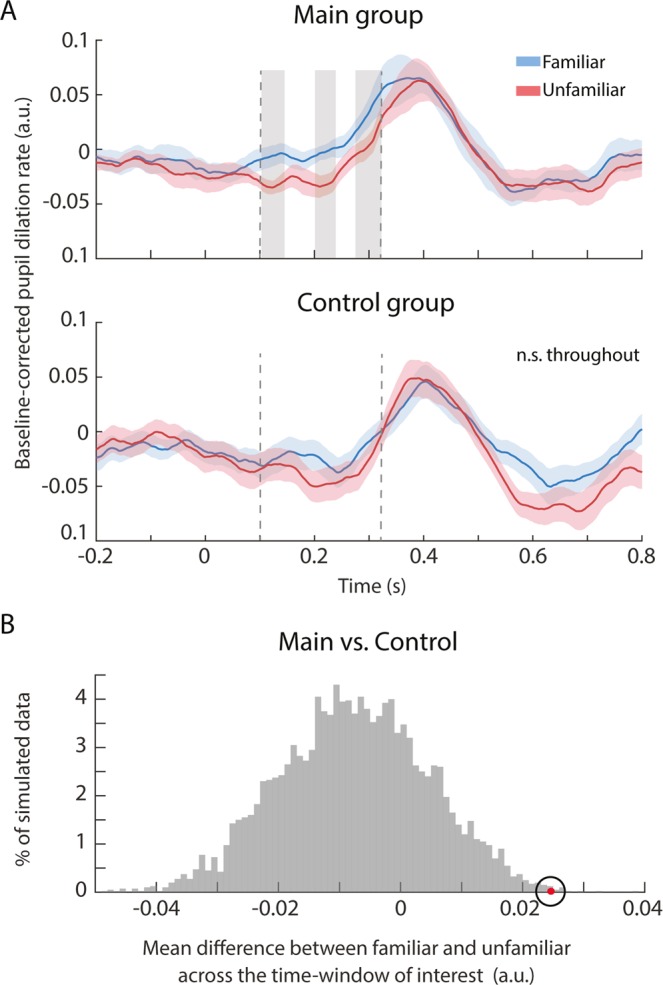
Figure 4.

Pupil dilation rate to familiar and unfamiliar snippets. (A) Top: Main group. The solid curves plot the average pupil dilation rate across participants for “familiar” (blue) and “unfamiliar” (red) conditions. The shaded area represents one standard deviation from the bootstrap mean. The grey boxes indicate time intervals where the two conditions were significantly different (108–135, 206–232, and 282–319 ms). The dashed lines indicate the time interval used for the resampling statistic in (B). Bottom: Control group. The solid curves plot the average pupil dilation rate over 10 randomly selected control datasets. The shaded area represents one standard deviation of the bootstrap mean. No significant differences were observed throughout the entire epoch. (B) Results of the resampling analysis to compare the difference between “familiar” and “unfamiliar” conditions between the main and control groups (averages are computed over the time interval 108–319 ms, indicated via dashed lines in (A)). The grey histogram shows the distribution of differences between conditions for the control group (H0 distribution). The red dot indicates the observed difference in the main group.
