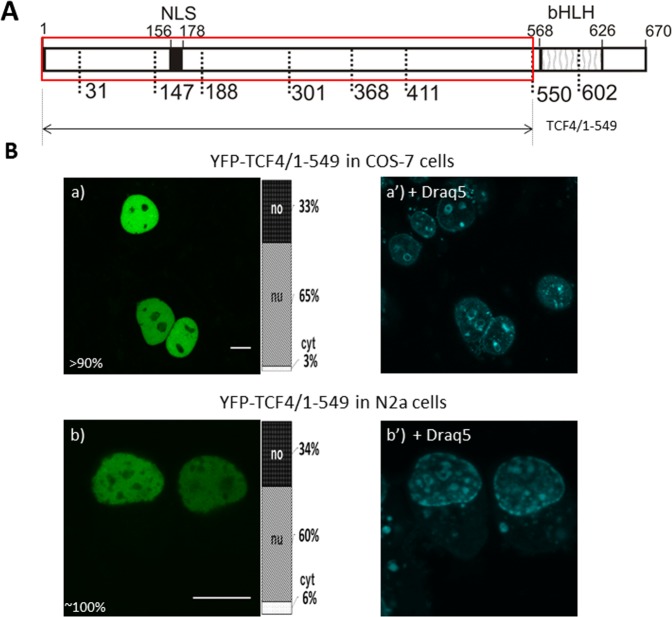
Figure 9.
Subcellular distribution of TCF4 with deletion of the bHLH domain (A) Schematic representation of TCF4 protein. Region of the studied area of TCF4 is shown by the red rectangle. Expressed deletion mutant of TCF4 is depicted as an arrow. The length of each domain in the diagram is arbitrary. (B) Subcellular localizations of the expressed protein was analysed by confocal microscopy 20-24 h after transfecting COS-7 and N2a cells. Draq5 was added to the cells for DNA visualization. Representative images (single confocal plane) of subcellular distribution of the TCF4/1-549 area. Bar, 10 µm. Ratios between mean fluorescence intensity in cytoplasmic, nuclear and nucleolar compartments are presented as an accumulated bar graph (no- nucleolus; nu- nucleus, cyt- cytoplasm). (a,a’) YFP-TCF4/188-300 expressed in COS-7 cells, (b,b’) YFP-TCF4/188-300 expressed in N2a cells.

