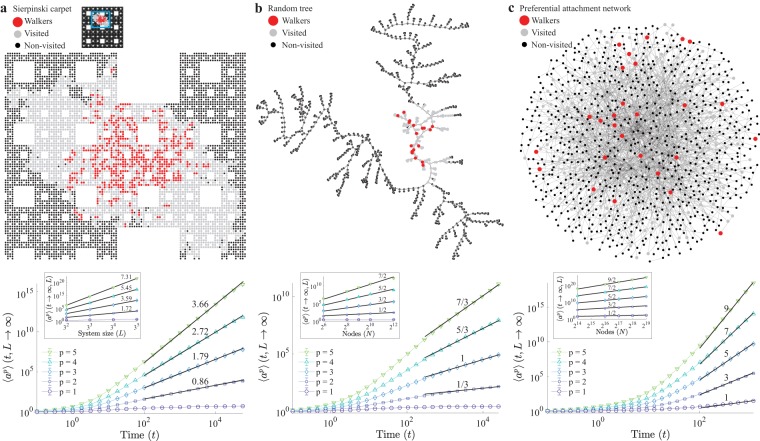
Figure 4.
Scaling on general graphs on (a), the Sierpinski carpet, (b), random tree and, (c), preferential attachment networks. The top row shows representative states (full Sierpinski carpet shown on inset), indicating walkers (red), visited sites (grey) and non-visited sites (black). The bottom row shows the scaling of moments of the number of distinct sites visited as a function of time, and linear system size (inset), or number of nodes, in the case of networks. The solid black lines represent the predicted scaling from Eq. (5). Simulation parameters: H = 0.1, s = e = 0.45, ε′ = 0, and γ → ∞.

