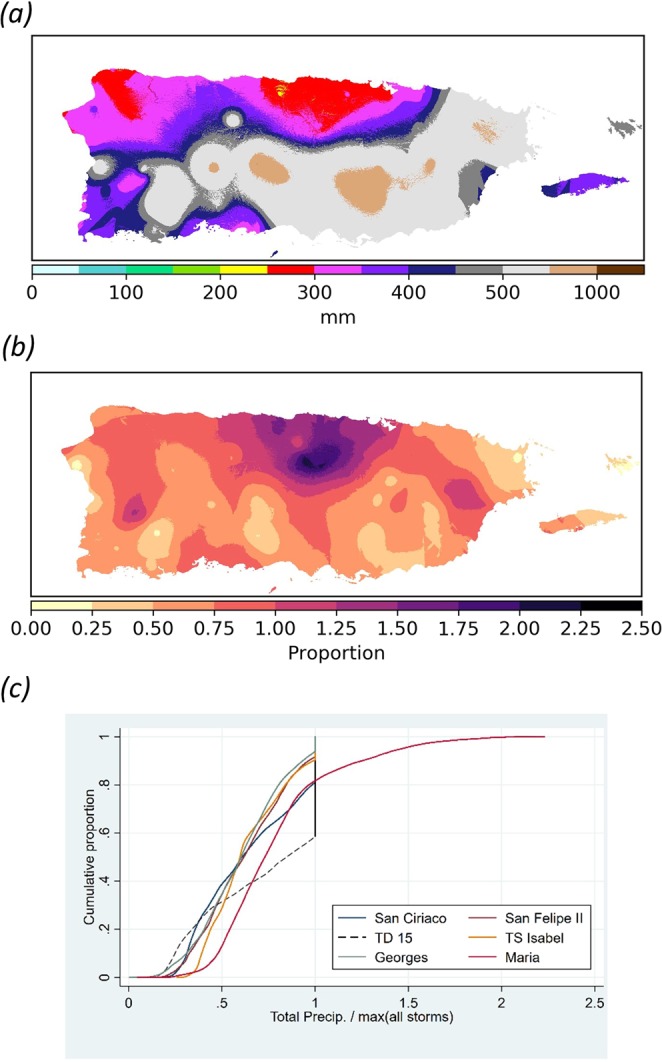
Figure 2.

Hurricane María’s total rainfall versus previous maximums. (a) Overall maximum interpolated rain totals for all tropical cyclones from 1898 to 2017 except Hurricane María; (b) Ratio of María’s interpolated total rainfall to the maximum interpolated total rainfall for all other tropical cyclones (ratio of Figs 1a to 2a) [values ≥ 1 denote locations where María represents the historical maximum total rainfall]; (c) Cumulative distribution of the ratio of storm total rainfall to the maximum total rainfalls prior to María for the six tropical cyclones with the highest total rainfall values.
