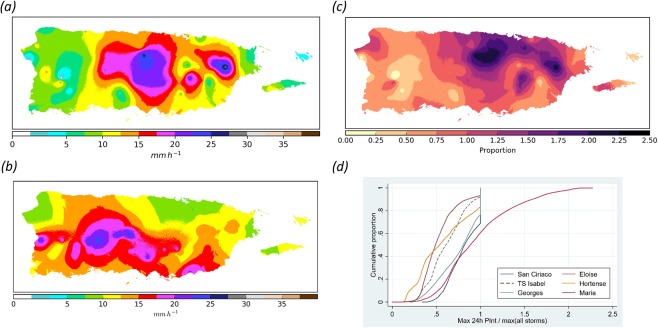
Figure 3.
Hurricane María’s 24-h rainfall intensity signature. (a) Spatial distribution of 24-h rainfall intensities in mm h−1 during Hurricane María based on co-krigging analyses; (b) Overall maximum interpolated rain intensities of all tropical cyclones from 1898 to 2017 except María; (c) Ratio of María’s interpolated 24-h rainfall intensities to the maximum interpolated rain intensities for all other tropical cyclones (ratio of a to b) [values ≥ 1 denote where María represents the historical maximum 24-h rainfall intensity]; (d) Cumulative distribution of the ratio of 24-hr rainfall intensities to maximum rain intensities prior to María for the six storms with highest rain intensities.

