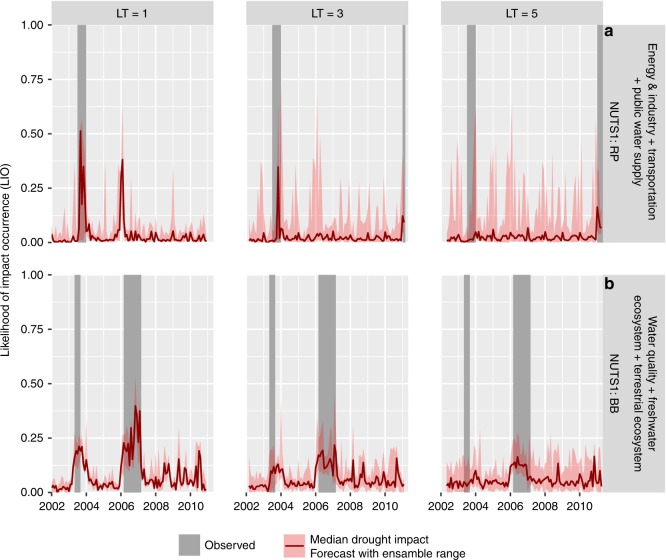
Fig. 2.
Examples of the re-forecasted Likelihood of Impact Occurrence (LIO). The figures show the examples of the re-forecasted LIO for three selected lead times (LT = 1, 3, and 5 months) for selected German NUTS-1 regions, i.e. Rheinland-Pfalz (RP) for impact Group 2 (a), and Brandenburg (BB) for impact Group 3 (b). The red line indicates the median re-forecasted LIO. The red-shaded area around the median indicates the ranges in which all ensemble members fall. The gray bars indicate periods with reported impacts (EDII20)

