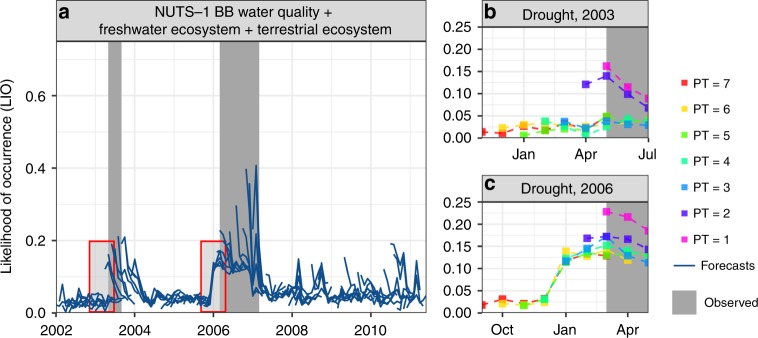
Fig. 3.
Illustration of the median re-forecasted LIO obtained from a drought early warning system. a Example of the re-forecasted LIO and reported drought impact (EDII, gray bars) for a German NUTS-1 region Brandenburg (BB) for the drought impact Group 3. Blue lines are the re-forecasted median LIO done for each month from January 2002 to December 2010 with LT = 1–7 months. b Detailed overview of the 2003 drought until July (impact forecasts start in November 2002), indicated by a red box in (a). c Detailed overview of the 2006 drought until May (impact forecasts start in September 2005), indicated by a red box in (a). The various colored lines give the forecasted LIO done at different times prior to (PT) the observed drought impact period for different LTs

