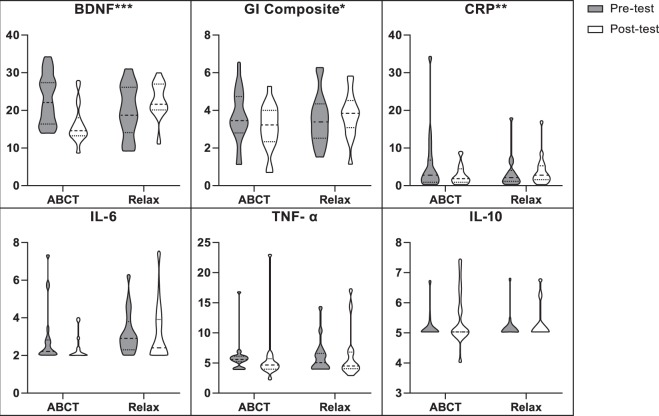
Figure 3.
Effects of ABCT vs. Relaxation on BDNF and inflammatory biomarkers. Note: Graphics are violin plots. The scales are different in different sections to make them legible (ng/ml in BDNF; pg/ml in CRP, IL-6, TNF-α and IL-10; and a natural logarithm normalization sum in the GI composite). Raw data was used in all measures (except for the GI Composite, which was calculated by adding the Z scores for the normalized log transformed IL-6, TNF-α and CRP values) to provide a more informed visualization of the treatment effects. *p < 0.05. **p < 0.01. ***p < 0.001.

