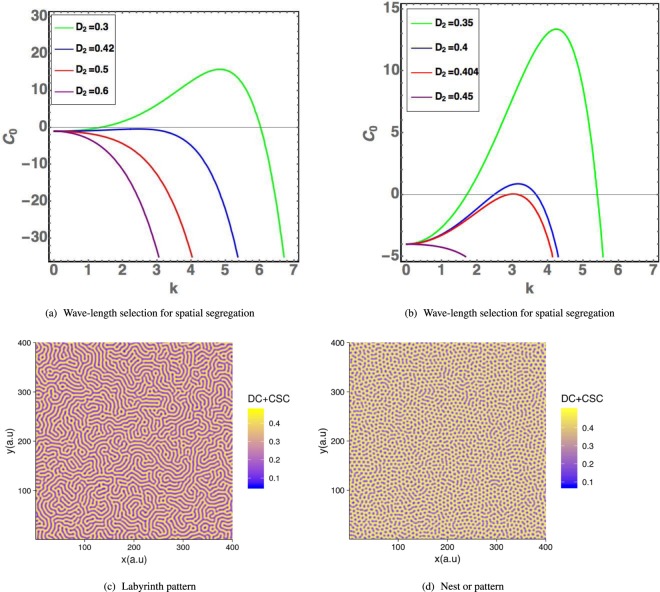
Figure 3.
Cell repartition study in the vicinity of fixed points in the domain of dynamical stability (see Fig. (1b)). In (a,b), results of the linear stability analysis with variation of the wave number k revealed by C0. In (a), the dynamical parameters are: = (0.2D2, D2, 0,0.2), with α = 1, Da = Dm = 1 and B = −5. in (b) the same parameter but with B = −20 (see Eq. (16) of the Appendix C). The Byrne-Preziozi potential41,42 is selected with the following values αD = 2, m = 1, Db = 0.6 and εD = 0.1 in Eq. (9). Phase separation of tumor cell CSC or DC with the surrounding tissue. In (c): Labyrinth-like pattern for {d, α} = {0.2, 1} and consequentially {D2, S2} ~ {0.23, 0.045}. (d): Honeycomb-like pattern for {d,α} = {0.15,0.8} and consequentially {D2, S2} ~ {0.4, 0.06}.

