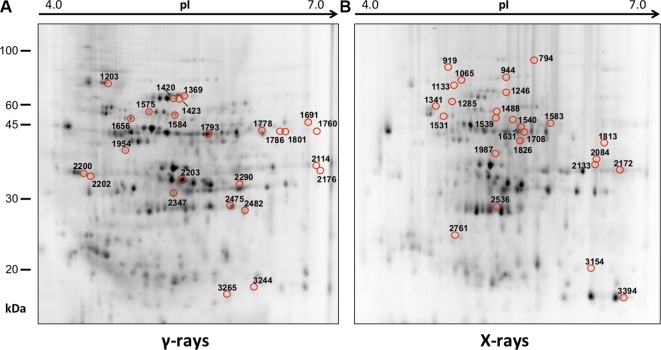
Figure 1.
Protein maps obtained from two-dimensional difference in-gel electrophoresis (2D-DIGE) analysis of “hairy root” culture (HRC) exposed to γ-rays (A) and X-rays (B). Silver-stained 2D gels are represented. Differentially represented protein spots (DRPs), indicated by circles, were isolated from the gel and analyzed by mass spectrometry. The corresponding list is reported in Tables 1 and 2.

