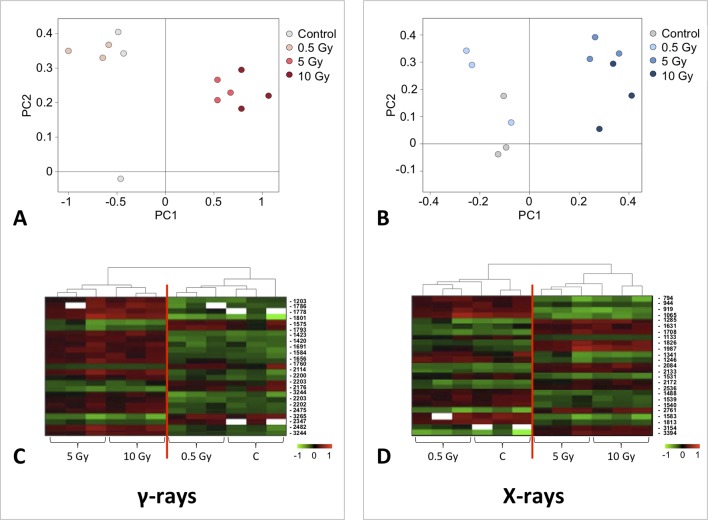
Figure 2.
Principal component analysis (PCA) of differential represented spots (p ≤ 0.05) obtained from the analysis of γ-rays (A) and X-rays (B) response. Each circle represents a spot map corresponding to a single HRC. Three HRCs (i.e., biological replicates) were independently exposed and analyzed for each irradiation condition, here displayed in different colors. The first two principal components PC1 and PC2 showed a variance of 78.1% and 11.7% for γ-ray analysis, and of 65.0% and 19.8% for X-ray analysis, respectively. Pattern analysis by hierarchical clustering (HCA) of the 25 differential spots for γ-rays response (C) and 25 differential spots for X-rays response (D) (listed on the right), based on their representation in the spot maps. The dendogram on the top of hierarchical clustering analysis (HCA) ordered the data so that similar data were displayed next to each other. HRC samples with similar expression profiles (i.e., similar expression over the spot maps) were clustered together. Red and green indicate overrepresented and downrepresented proteins according to the scale at the bottom of the figure.

