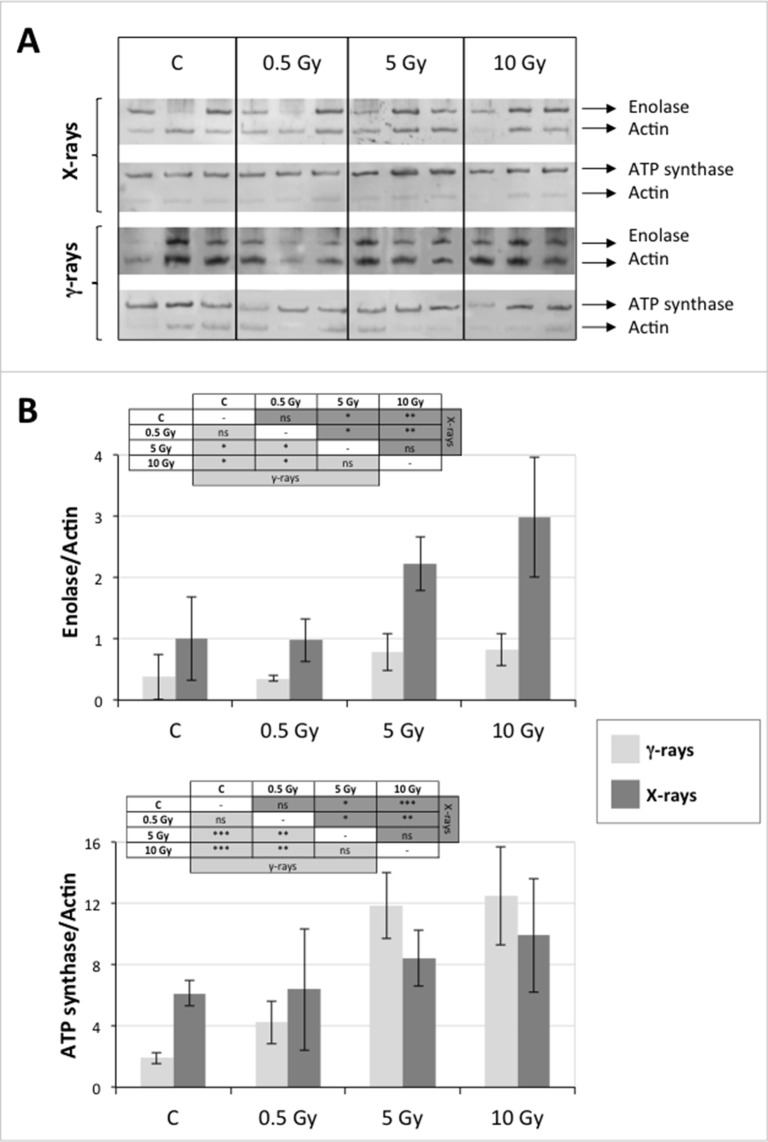
Figure 5.
Immunoblotting analysis performed to validate 2D-DIGE results. (A) Specific polyclonal antibodies were used to detect the expression of enolase and ATP synthase in HRCs, independently exposed to X- and γ-radiation. Actin expression was used to normalize protein quantity. (B) Immunoblot signals were quantified by densitometric analysis. Data are presented as means values obtained from three biological replicates ± standard deviation. Tables show the results of one-way ANOVA followed by Fisher’s least significant difference (LSD) test, based on three replication sample dimension. Statistical significance is indicated with asterisks: ∗ = p < 0.05; ∗∗ = p < 0.01; ∗∗∗ = p < 0.001. ns: no statistically significant differences.

