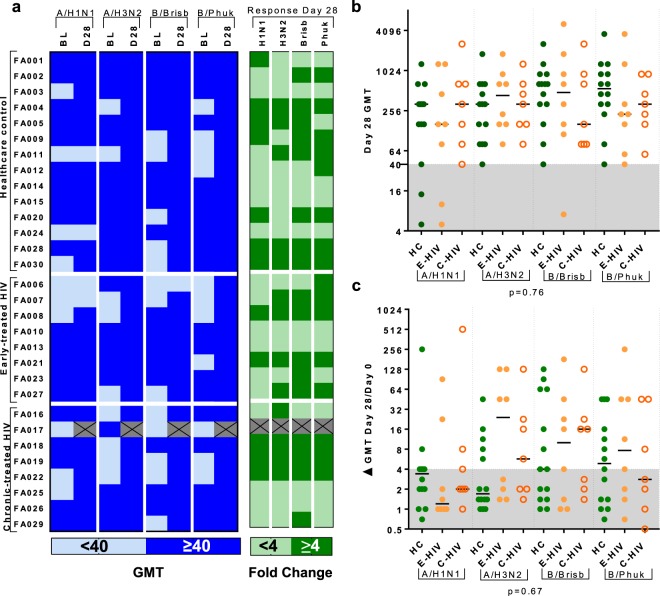
Figure 1.
QIV induces equivalent humoral responses in PLWH and male control subjects. (a) Table showing haemagglutination inhibition assay (HAI) response geometric mean titre (GMT) in all participants. Left column: the baseline (BL) and Day 28 (D28) HAI titre. Those seroprotected (SP, HAI titre ≥40) are shown in dark blue, those not seroprotected (NSP, HAI titre <40) in light blue. Right column: Day 28 fold change in HAI titre. Responders (R, HAI titre ≥4 fold increase) are shown in dark green and non-responders (NR, HAI titre <4 fold increase) in light green. Crossed cells indicate incomplete data. (b) Graph shows Day 28 HAI titre against each of the influenza-A and B strains in, healthcare control subjects (HC), those with early-treated HIV (E-HIV) and those with chronic-treated HIV infection (C-HIV). Shaded area indicates HAI titre <40. (c) Graph shows Day 28 fold change in HAI titre against each of the influenza-A and -B strains in HC, E-HIV and C-HIV. Shaded area indicates HAI titre fold change <4. Lines on graph panels indicate the median. Individual data points are shown: HC, filled green circles; E-HIV, filled orange circles; C-HIV, open orange circles. p values indicate results of Kruskal-Wallis test (below graph).

