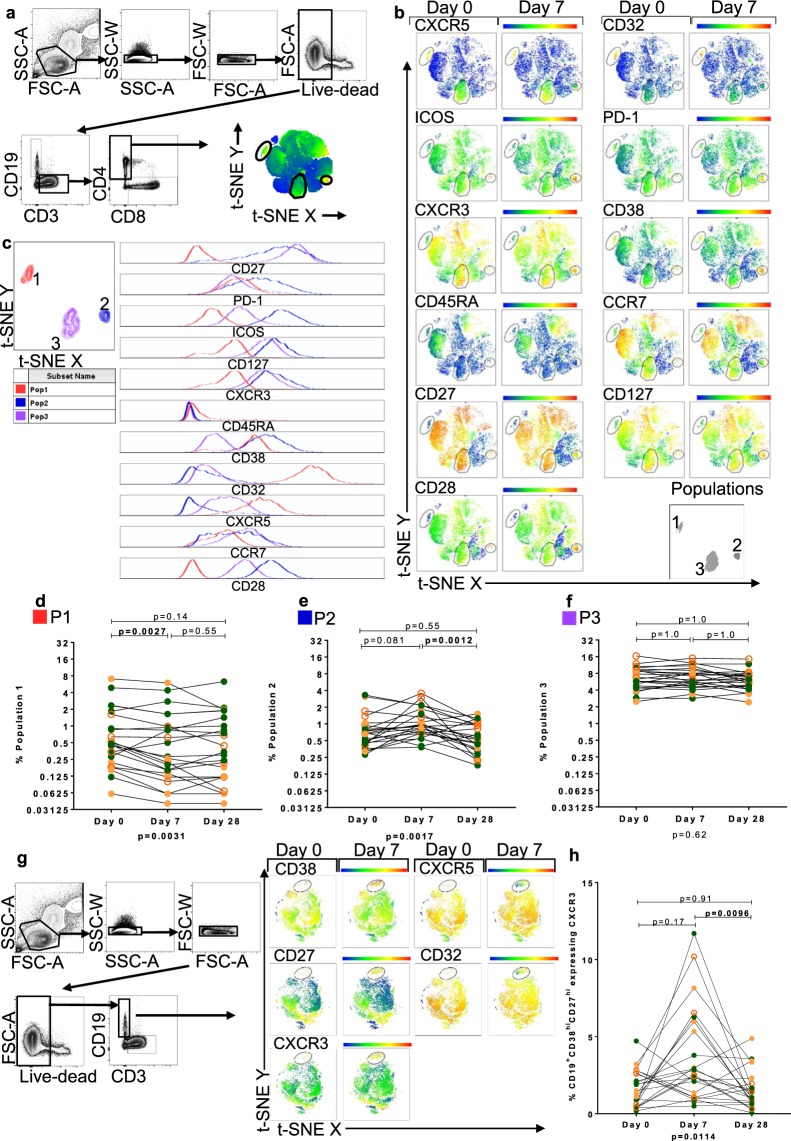
Figure 3.
T-stochastic neighbour embedding (t-SNE) analysis identifies three CD4+ T cell populations expressing CXCR5 pre and post QIV. (a) Gating strategy and t-SNE analysis of live CD3+CD4+ lymphocytes in all participants at all time-points. Heatmaps depict the relative expression of each antigen, the scale from high (red) to low (blue) expression. (b) Representative t-SNE analysis of live CD3+CD4+ lymphocytes of one C-HIV participant showing the relative expression of T cell markers at Day 0 and Day 7 post QIV. Three populations of interest defined by CD32 and CXCR5 expression were gated on all participants and labelled Populations 1, 2 and 3 (bottom right panel). (c) Characterisation of P1–3 using histograms derived from t-SNE analysis. Data from concatenated file of all individuals’ data. Left panels show P1 (red), P2 (blue) and P3 (purple). Histograms, right panel, show the relative expression of T cell markers measured. Panels show the frequency of P1 (d), P2 (e) and P3 (f) from t-SNE analysis, at each time point. (g) Representative gating and t-SNE analysis of one C-HIV participant showing live CD19+ lymphocytes of all participants at Day 0 and Day 7 showing appearance of CD38hiCD27hiCXCR3hi antibody secreting cells at Day 7. (h) Frequency of CXCR3hi ASCs from t-SNE analysis at each time point. Statistical analysis was performed using a Friedman test (p value below graph) and Dunn’s multiple comparisons test (p value above graph). Individual data points are shown: HC, filled green circles; E-HIV, filled orange circles; C-HIV, open orange circles.

