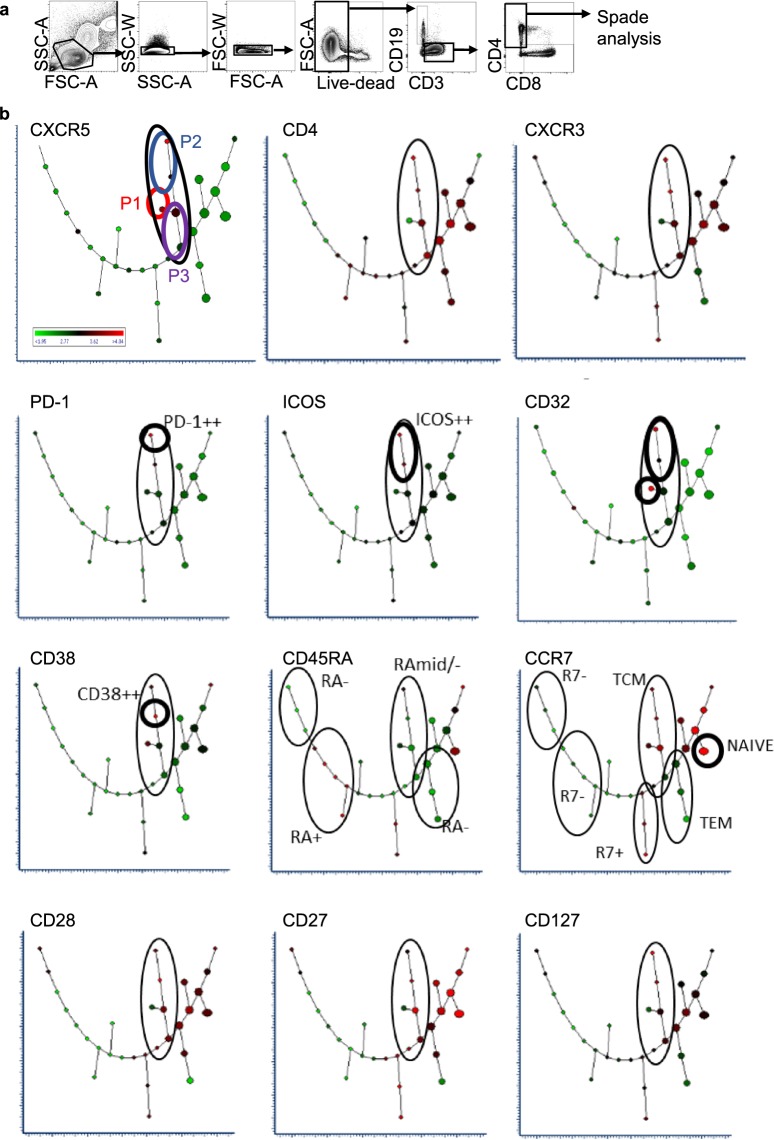
Figure 4.
Spanning-tree Progression Analysis of Density-normalized Events (SPADE) of CD4+ T cells. (a) Representative gating strategy of live CD4+ T cells from one individual. (b) SPADE analysis of live CD3+CD4+ cells showing combined flow cytometry standard (FCS) dataset from all participants at all time-points. Cluster size indicates relative frequency of live CD3+CD4+ events. Cluster colour indicates relative marker expression; with scale from green (low) to red (high).

