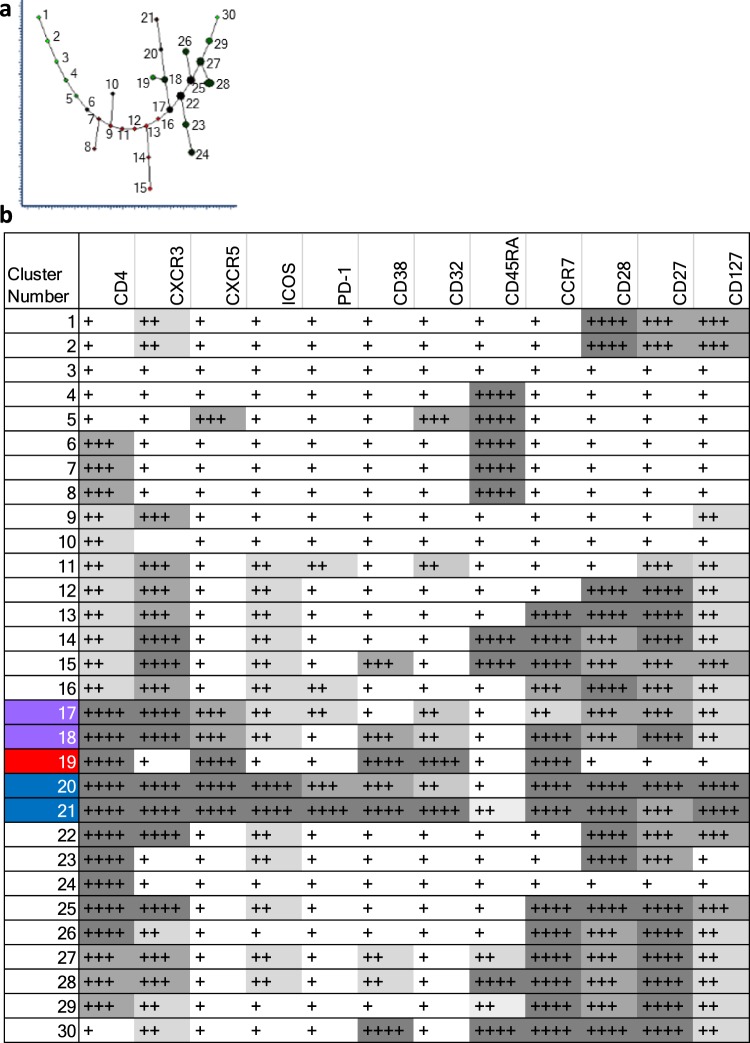
Figure 5.
Summary of relative cellular marker expression on CD4+ T cell populations using Spanning-tree Progression Analysis of Density-normalized Events (SPADE). (a) Plot showing the assigned cluster number. (b) Panel shows the cluster number, left column, and relative expression of each marker denoted as low-expression (+ white background); mid-expression (++ light grey background); mid/high-expression (+++ mid-grey background), high-expression (++++ dark grey background). Translation of SPADE cluster colour into comparative expression levels was through visual discrimination on each SPADE readout using the combined dataset. Highlighted clusters in column 1 correspond to those bearing similarities to CD4+ T cell populations of interest identified using t-SNE; clusters 17–18 in purple (P3), cluster 19 in red (P1) and clusters 21 and 21 in blue (P2).

