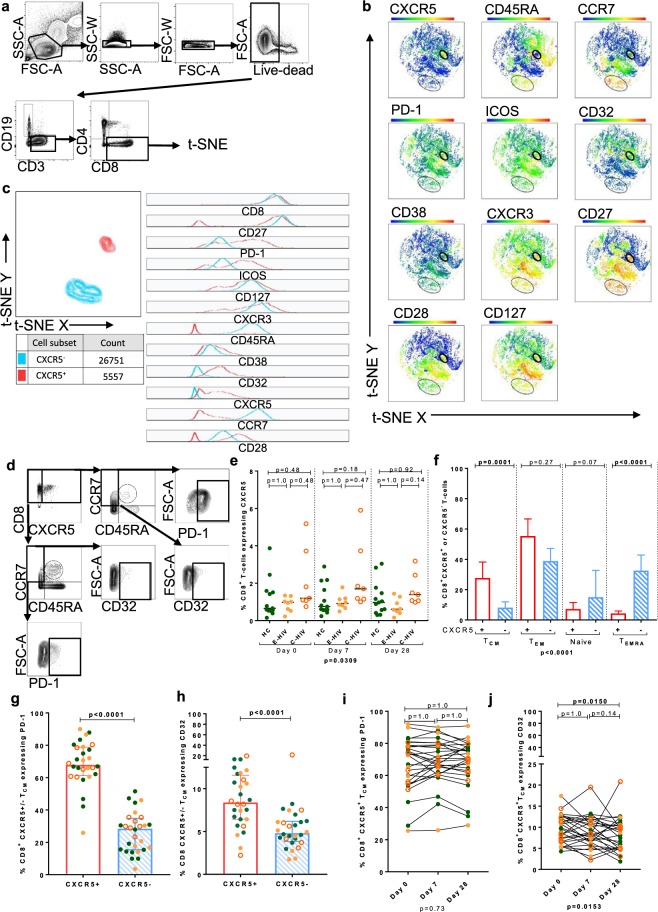
Figure 7.
Identification of a rare population of CXCR5+CD8+ central memory T cells that is not activated by QIV. (a) Gating strategy and t-SNE of live CD3+CD8+ lymphocytes of all participants at all time points. Heatmaps show the relative expression of each marker. (b) t-SNE of live CD3+CD8+ lymphocytes of one C-HIV participant showing the CXCR5+ and CXCR5−populations. (c) Characterisation of CD8+CXCR5−(blue peaks) and CD8+CXCR5+ (red peaks) T cells using histograms derived from t-SNE on concatenated data from all individuals to determine the relative expression of cellular markers. (d) FACS gating strategy for CD8+CXCR5+ T cells and T cell memory subsets. (e) Comparison of the frequency of CXCR5+CD8+ T cells in HC, E-HIV, C-HIV at all time-points (f) Comparison of the frequency of CD8+CXCR5+ (red columns) and CD8+CXCR5- (blue columns) T cells that were, from left to right, central memory cells (TCM: CD45RA−CCR7+), (TEM: CD45RA−CCR7−), (Naive: CD45RA+CCR7+), (TEMRA: CD45RA+CCR7−). Comparison of the frequency of CD8+CXCR5+ and CD8+CXCR5−TCM-cells expressing (g) PD-1 and (h) CD32. (i) Frequency of CD8+CXCR5+ PD-1+ T cells and (j) CD8+CXCR5−PD-1+ T cells at all time−points. P values were derived using a Kruskal-Wallis or Friedman test (p value below graph) and p values of the Dunn’s multiple comparisons test (above graph). Comparisons between groups were performed using a two-tailed Mann-Whitney U test.

