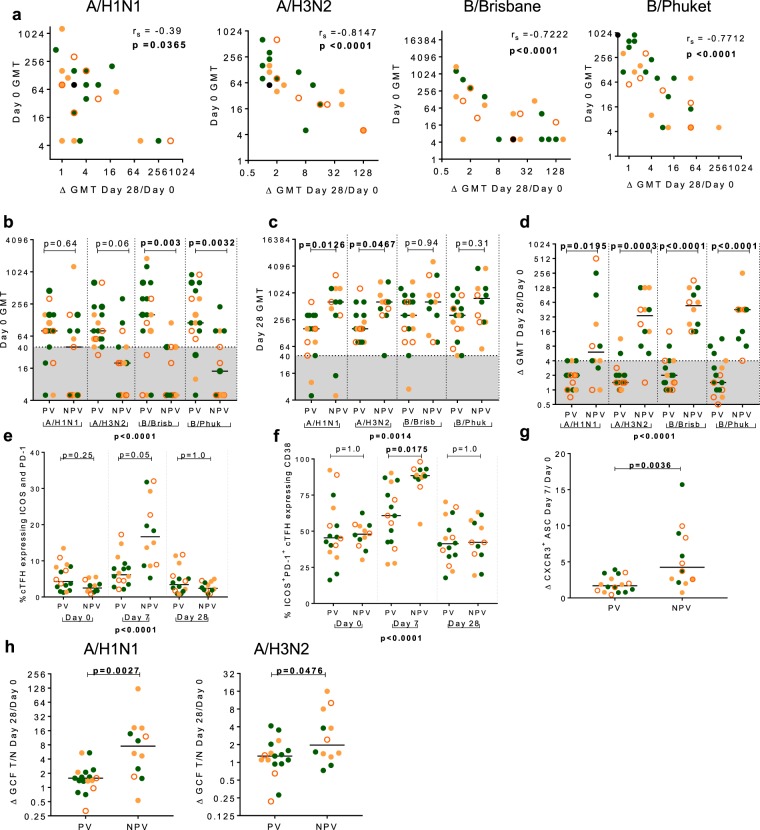
Figure 8.
Activation of T and B cells post QIV is attenuated in those self-reporting vaccination with seasonal influenza vaccine in the preceding three years. (a) Panels show inverse correlation between Day 0 HAI titre and fold change in HAI titre at Day 28 in A/H1N1, A/H3N2, B/Brisbane and B/Phuket. Comparison of HAI titre in those self-reporting a previous history of vaccination (PV) or no previous vaccination (NPV) at (b) baseline and (c) Day 28 against A/H1N1, A/H3N2, B/Brisbane and B/Phuket. Shaded area indicates HAI titre <40. (d) Comparison in the fold change in HAI titre between PV and NPV against A/H1N1, A/H3N2, B/Brisbane and B/Phuket. Shaded area indicates HAI titre fold change <4. (e) Comparison of the frequency of cTFH that expressed ICOS and PD-1 at all time points in PV and NPV. (f) Comparison of the frequency of ICOS+PD-1+ cTFH that expressed CD38+ at all time-points in PV and NPV. (g) Day 7 fold change in the frequency of CXCR3+ ASCs comparing PV and NPV. (h) The fold change in GCF T/N ratio against A/H1N1 and, A/H3N2 comparing PV and those NPV. Lines are drawn at the median. Individual data points are shown on graph panels: HC, filled green circles; E-HIV, filled orange circles; C-HIV, open orange circles. Spearman’s rank correlations coefficient, rs is shown. P values were derived using a Kruskal-Wallis test (p value below graph) and p values of the Dunn’s multiple comparisons test (above graph). Comparisons between two groups were performed using a two-tailed Mann-Whitney U test.

