
Figure 6.
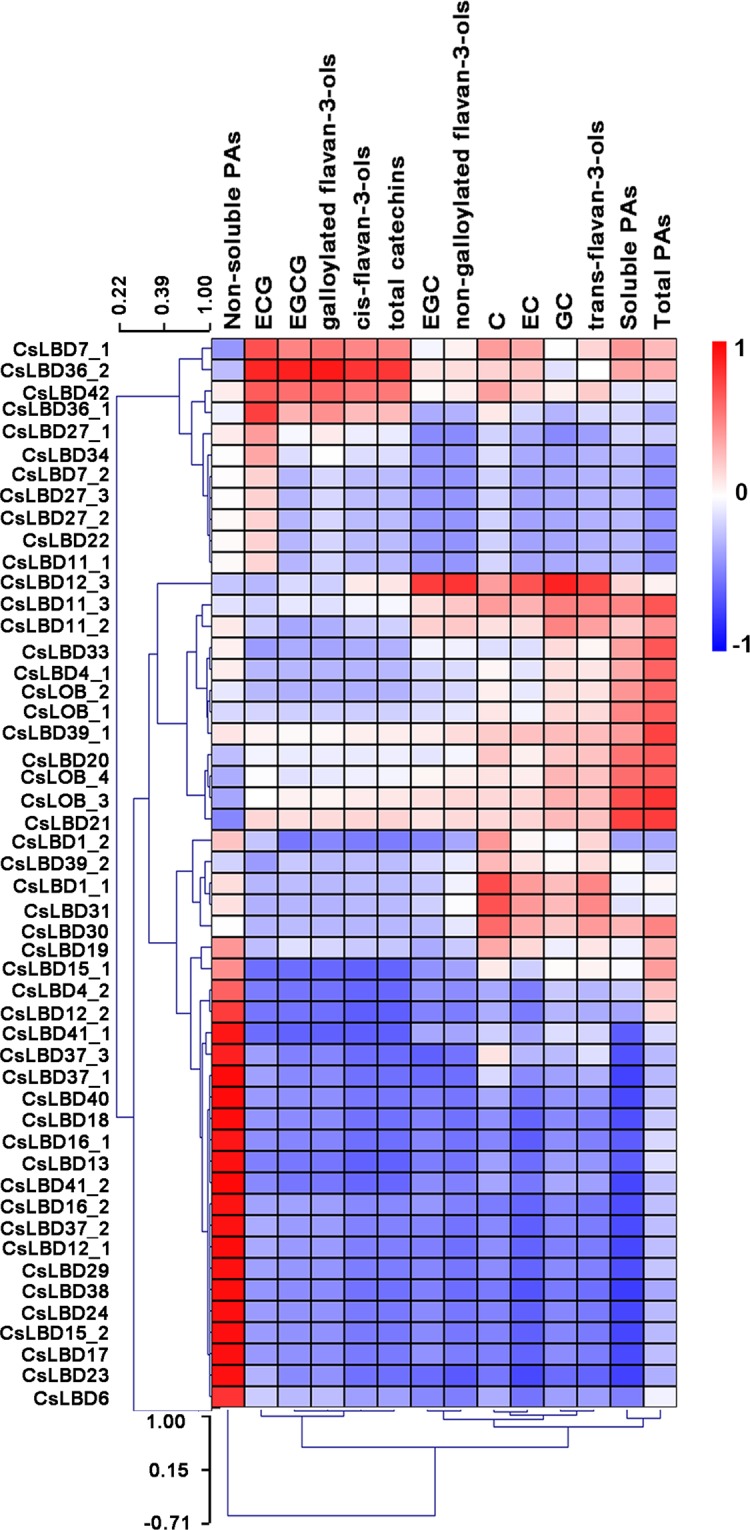
Integrative analysis of CsLBD expression levels and metabolite accumulation in tea tissues. Correlation analysis with 13 metabolites and 50 transcripts of CsLBD. R > 0.5: Positive correlations; R < −0.5: negative correlation.
Official websites use .gov
A
.gov website belongs to an official
government organization in the United States.
Secure .gov websites use HTTPS
A lock (
) or https:// means you've safely
connected to the .gov website. Share sensitive
information only on official, secure websites.
Integrative analysis of CsLBD expression levels and metabolite accumulation in tea tissues. Correlation analysis with 13 metabolites and 50 transcripts of CsLBD. R > 0.5: Positive correlations; R < −0.5: negative correlation.