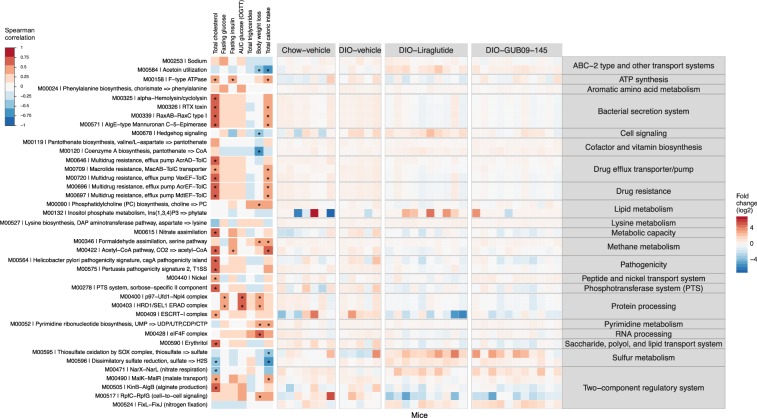
Figure 6.
Bacterial KEGG metabolic pathways affected by treatment with liraglutide and GUB09-145. Heatmap depicting bacterial KEGG modules with changes over the course of liraglutide and GUB09-145 treatment. Left heatmap: Spearman correlations between change in individual species abundance and various metabolic parameters affected by treatment, including plasma total cholesterol (TC), fasting glucose level on treatment day 14 (Fasting glucose), fasting terminal insulin levels (fasting insulin), glucose area-under the curve in an oral glucose tolerance test on treatment day 27 (AUC glucose OGTT), terminal plasma total triglycerides (TG), endpoint body weight loss relative to baseline (Body weight loss), and total caloric intake during the treatment period (Total caloric intake). Asterisks denote significant correlation (FDR-corrected, p < 0.05) between species and relevant metabolic parameter. Right heatmap: Fold change (log2 transformed) in species abundance in individual mice as compared to baseline.

