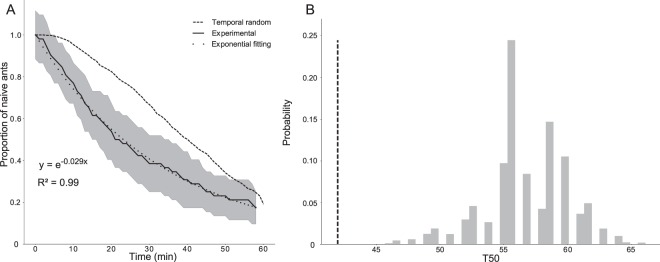
Figure 2.
(A) Survival curves of the proportion of the naïve ants (that still had not performed any trophallactic events) in the experimental networks (full black line = mean from experiments, grey area = standard deviation, N = 5 experiments) and in the RP reference networks (temporal randomisation, dashed black line, mean from N = 1000 for each experiment). Dotted black line = exponential fitting. (B) Example from one experiment: empirical (vertical dotted line) and theoretical distributions (grey bar, from 1000 RP reference networks) of the T50 for the half of the population that performed at least one trophallactic exchange, ZT: Z = −4.51, p < 0.0001. See Fig. S4 for details of the other experiments.

