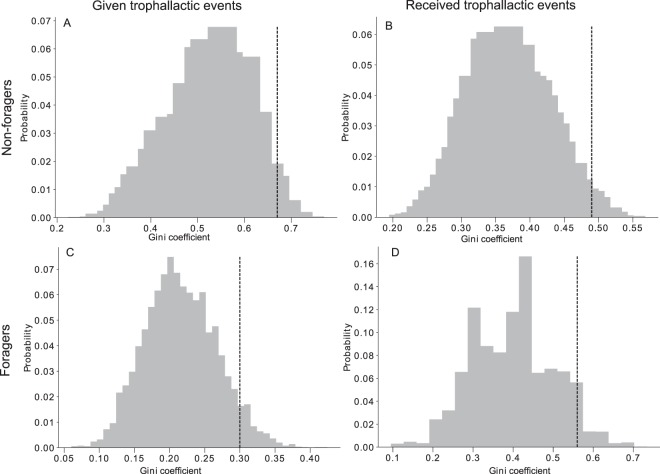
Figure 5.
Mean observed (vertical dotted line, N = 5) and theoretical distribution (grey bar, N = 5 * 1000) of the Gini coefficient of the trophallactic events given (Fig. 5A, ZT, Z = 1.91, p = 0.028) and received (Fig. 5B, ZT, Z = 2.00, p = 0.022) by the non-foragers and the trophallactic events given (Fig. 5C, ZT, Z = 1.49, p = 0.067) and received (Fig. 5D, ZT, Z = 1.45, p = 0.073) by the foragers.

