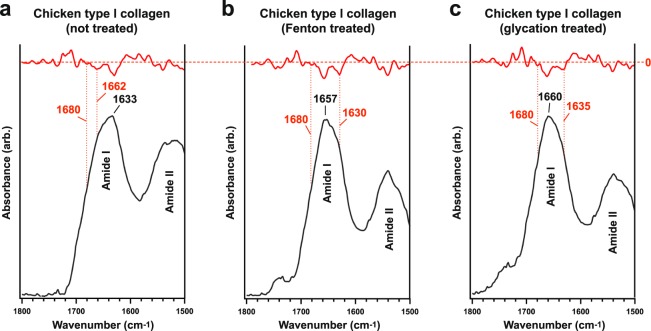
Figure 1.
Amide I sub-band localisation of untreated and treated chicken type I collagen in SR-FTIR spectra. Sub-bands (β-sheet, ~1633 cm−1; triple-helix, ~1658–1660 cm−1; intermolecular, ~1683–1690 cm−1) are indicated in the figures. Red traces denote second derivatives of experimental curves. Although the intermolecular sub-band typically presents at lower wavenumber, the identified value was the nearest local minimum in each of the second derivative traces and consistently appears across all samples; therefore, in this sample, the intermolecular sub-band was indexed at 1697–1699 cm−1.

