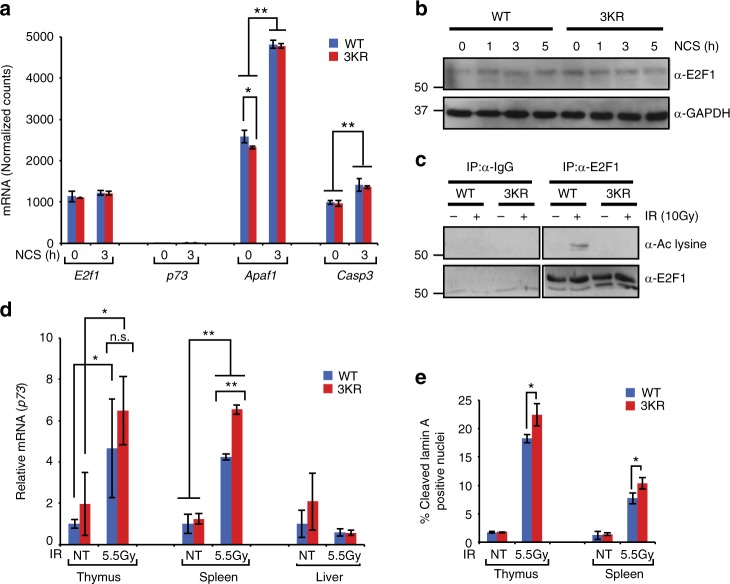
Fig. 4.
Characterization of the E2F1 acetylation 3KR knock-in mouse model. a RNA-seq was performed on wild-type (WT) and E2f13KR/3KR (3KR) MEFs untreated or treated with NCS (250 ng/ml for 3 h) and the normalized mRNA counts for E2f1, p73, Apaf1, and Caspase3 (Casp3) are presented. b Western blot analysis was performed to examine E2F1 protein levels in primary wild-type (WT) and E2f13KR/3KR (3KR) MEFs before and after DNA damage with NCS (250 ng/ml) for the indicated times. c Wild-type and E2f13KR/3KR MEFs were untreated or exposed to 10 Gy IR and cell extracts made 2 h later. Co-immunoprecipitation was performed using control IgG or antibody to E2F1 (C-20, rabbit polyclonal) followed by western blot analysis for acetylated lysine (top) or E2F1 (bottom) using a different antibody (KH95, mouse monoclonal). d Wild-type (WT) and E2f13KR/3KR (3KR) mice were exposed to 5.5 Gy of IR and tissues collected 2 h later. Total RNA was isolated and cDNA was prepared by RT-PCR using random hexamer primer. Expression of p73 in the thymus, spleen, and liver was determined by qPCR. e Wild-type (WT) and E2f13KR/3KR (3KR) mice were exposed to 5.5 Gy of IR and thymus and spleen tissues were collected 2 h later. Tissue sections were stained for the cleaved form of Lamin A. The average of percentage of positive nuclei is presented. All graphs represent average ± SD of three independent experiments (n = 3) of cells or mice. P values were calculated by unpaired Student’s t test. **P ≤ 0.01 is highly significant and *P ≤ 0.05 is significant. Source data of b and c are provided as Supplementary Data 5. Raw data of a, d, and e are in Source Data File

