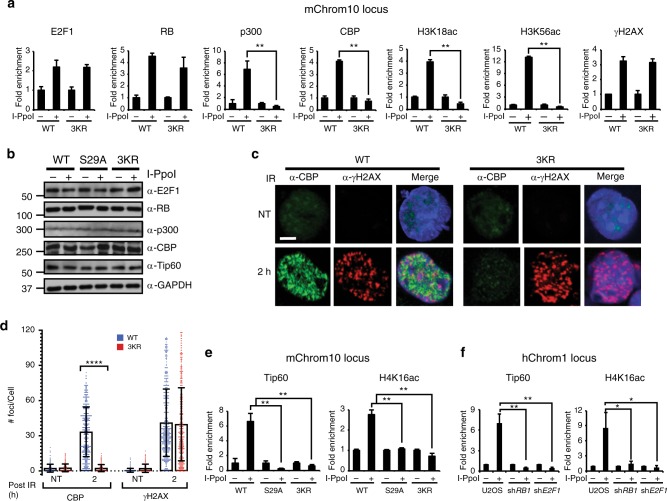
Fig. 5.
The E2F1 3KR mutation impairs multiple histone acetylation events at DSBs. a Primary wild-type (WT) and E2f13KR/3KR (3KR) MEFs were subjected to the I-PpoI ChIP assay and qPCR was performed to determine the occupancy of the indicated proteins and H3 acetylation marks at mChrom10 locus. b Wild-type (WT), E2f1S29A/S29A (S29A), and E2f13KR/3KR (3KR) MEFs were uninfected or infected with a retrovirus expressing inducible I-PpoI, treated with 4-OHT, and western blot analysis was performed for E2F1, RB, p300, CBP, Tip60, and GAPDH. c Wild-type and E2f13KR/3KR MEFs were mock treated (NT) or exposed to 5 Gy of IR 2 h prior to in situ extraction and fixation. Representative images show formation of IR-induced foci for CBP (green) and γH2AX (red) and merged with DAPI staining (blue) of nuclei. Bar, 10 μm. d Quantification of CBP and γH2AX foci. Each treatment group was in triplicate, and in total at least 450 cells (n > 450) were counted per treatment group. Graphs represent average ± SD of foci per cell. Overlaid scattered dot plot shows the distribution of foci. P values were calculated by unpaired Mann–Whitney U test. ****P < 0.0001 is highly significant. e Primary wild-type (WT), E2f1S29A/S29A (S29A), and E2f13KR/3KR (3KR) MEFs were subjected to the I-PpoI ChIP assay and occupancy of Tip60 and H4K16ac at mChrom10 locus was determined. f Parental U2OS cells and U2OS cells expressing shRNA to RB1 and E2F1 were subjected to the I-PpoI ChIP assay and qPCR was performed to determine occupancy of Tip60 and H4K16ac at hChrom1 locus. Except d, other graphs represent average ± SD of three independent experiments (n = 3). P values were calculated by unpaired Student’s t test. **P ≤ 0.01 is highly significant and *P ≤ 0.05 is significant. Source data of b is provided as Supplementary Data 5. Raw data of a and d–f are in Source data file

