Fig. 7.
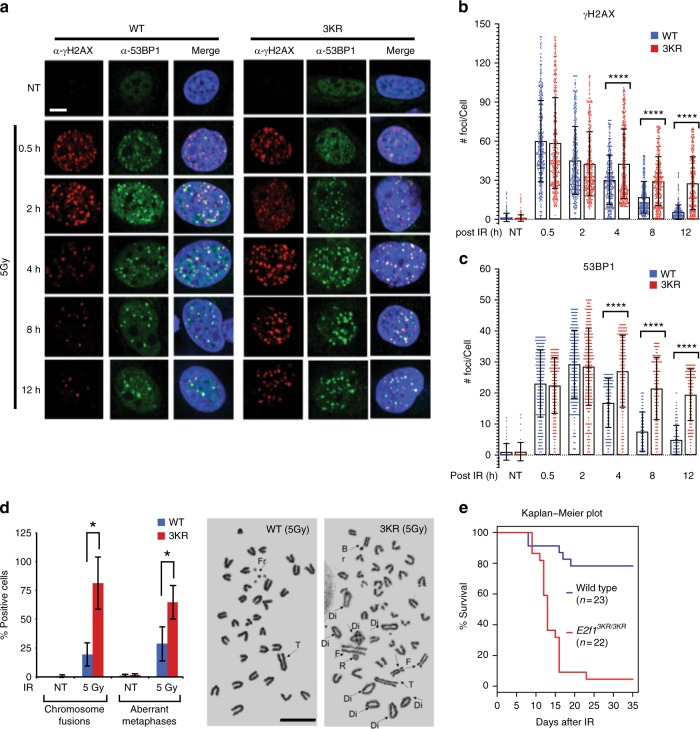
The 3KR mutation causes defective DNA repair phenotypes. a Primary wild-type (WT) and E2f13KR/3KR (3KR) MEFs were mock-treated (NT) or treated with 5 Gy of IR and allowed to recover for the indicated times. Representative confocal microscopic images show the formation and disappearance of γH2AX (red) and 53BP1 (green) foci and the merge with DAPI staining (blue) of nuclei. Bar, 10 μm. b, c Quantification of γH2AX foci (b) and 53BP1 foci (c) at the indicated times after IR was performed. Each treatment group was in triplicate, and in total at least 450 cells (n > 450) were counted per treatment group. Graphs represent average ± SD of foci per cell. Overlaid scattered dot plot shows the distribution of foci. P values were calculated by unpaired Mann–Whitney U test. ****P < 0.0001 is highly significant. d Primary wild-type (WT) and E2f13KR/3KR (3KR) MEFs were mock-treated (NT) or treated with 5 Gy of IR, and after 48 h, metaphase spreads were prepared. Chromosome fusions including dicentrics and rings and aberrant metaphases were counted and expressed as the percentage of positive cells. Each treatment group was in triplicate (n = 3), and at least 50 metaphases were counted per sample in the triplicate. Graphs represent average ± SD. P values were calculated by unpaired Student’s t test. *P ≤ 0.05 is significant. Representative metaphase spreads are shown with arrows pointing to Fr—Fragment, Di—Dicentric, R—Ring, F—Fusion, Br—Break, and T—Tandem translocation. Bar, 10 μm. e Wild-type (n = 23) and E2f13KR/3KR (n = 22) mice were exposed to 5.5 Gy of IR and maintained for up to 35 days. Statistical significance in survival rates between genotypes was determined using the Kaplan–Meier method and P value was calculated by log-rank test. P < 0.0001 is highly significant. Raw data of averages in graphs underlying b–e are given in Source Data File

