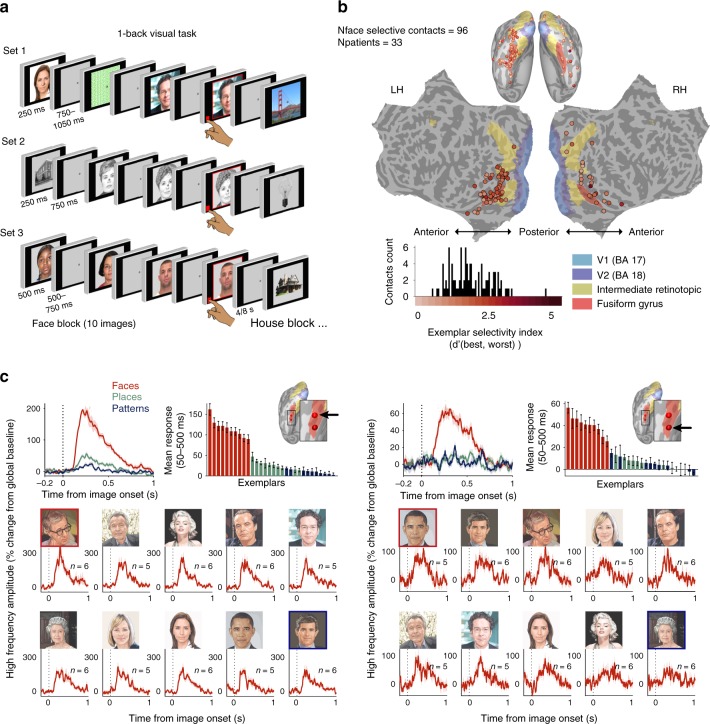
Fig. 1.
Experimental design, localization and exemplar selectivity of face selective iEEG contacts. a Schematic illustration of the 1-back visual tasks. Three versions, each including a different set of face stimuli and additional images from other categories, were included in the study. Every patient took part in either one or two versions out of the three. Faces used in set 3 (examples shown here) were taken from the face database by Minear and Park56. b Anatomical distribution of detected face contacts, projected onto a common template of the inflated (ventral view, top) and flattened cortex. Color coding denotes exemplar selectivity indices, defined as the d′ between the most- and the least-preferred face exemplars. Histogram presents the distribution of selectivity indices alongside the color code bar. The same distribution is presented separately for each of the three sets in Supplementary Fig. 1. c Example of two neighboring face contacts implanted in the same patient, their anatomical locations marked by black arrows on the inflated left hemisphere. Top left panel depicts the mean HFA response across face, place, and pattern exemplars in set 1, demonstrating robust face selectivity. Top right bar plot depicts the mean HFA response (50–500 ms) to each of the exemplars in a descending order of activation, with bar colors denoting visual category. Bottom galleries present the mean HFA response of each contact to the different faces with the corresponding images. Galleries are presented in a descending order of mean response (as in the bar plots). HFA was normalized to % signal change from global baseline at −200 to 0 ms. All error bars denote s.e.m. Note the differences in response amplitude to different exemplars which was unique to each iEEG contact. Faces shown for sets 1 and 2 in all figures are accurate illustrations of the original images used, in compliance with copy rights limitations. Exceptions are Fig. 4 and Supplementary Fig. 12, in which original images of most exemplars in set 1 are shown

