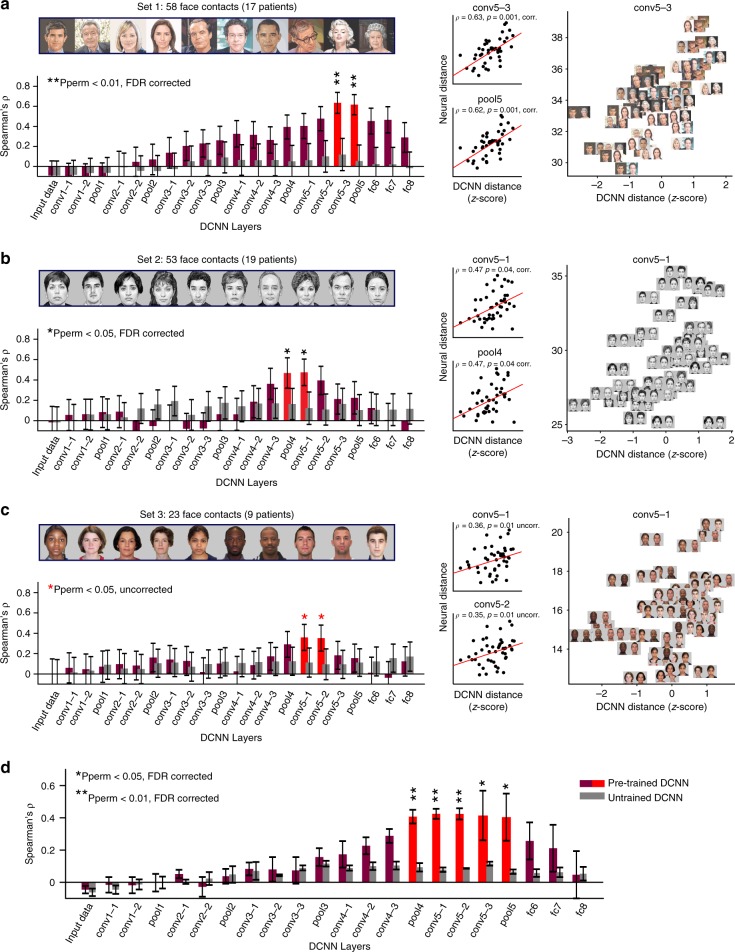
Fig. 2.
Pair-wise distances in the neural face-space match the same distances in intermediate DCNN layers. a Left: Purple and red bars denote the correlation between pair-wise distances in iEEG face-selective contacts included in set 1 and in the different layers of a DCNN pre-trained on face recognition (VGG-Face). Gray bars denote the same correlations, but to untrained VGG-Face layers. Face exemplars included in set 1 are presented above the bar plot. Error bars denote image pairs bootstrap s.e.m. Middle: Scatter plots which underlie the correlation in the significantly correlated DCNN layers. Red line is the least-squares linear regression fit. Right: Enlarged scatter plot for the maximally correlated DCNN layer (same data as in the top scatter plot in middle panel), with images of face pairs presented on top of individual dots. b, c Same as panel a, only for sets 2 and 3, respectively. Faces used in set 3 (and shown here in panel c) were taken from the face database by Minear and Park56 . Note that each set consisted of a different (yet partially overlapping) group of face contacts given the group of patients who participated in the corresponding task version. d Weighted averages of the correlation coefficients observed across the three sets. Sets were weighted by the number of face contacts they included. Error bars denote the weighted s.e.m. across the sets. Note the consistent correlation of the iEEG recordings to mid-level DCNN layers. All p values were derived from an image permutation test (1000 permutations). Reported p values are FDR corrected, except for set 3 in which significance did not survive FDR correction

