Figure 1.
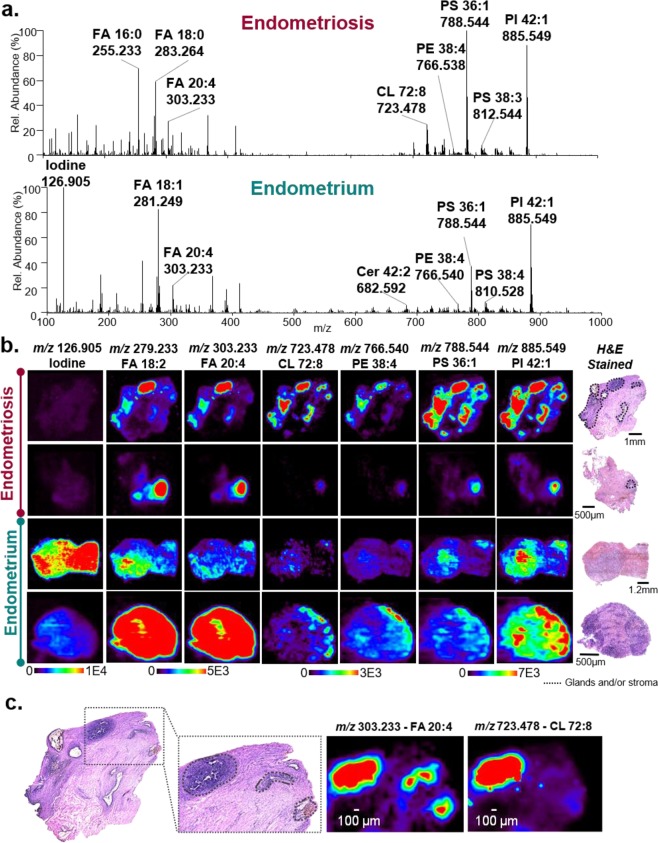
Negative ion mode DESI-MS imaging data acquired from endometriosis and eutopic endometrium tissues obtained from different patients. (a) Selected DESI-MS profiles from the endometrial glands within ectopic endometrial tissue collected from endometriosis lesions (top) and eutopic endometrial tissue from inside the uterus (bottom). The spectra shown are an average of 10 scans. (b) Selected DESI-MS ion images of endometriosis and endometrium tissues. Regions of endometrial glands and stroma within the lesions are outlined in black on the optical images of the H&E stained tissue sections. (c) High magnification view of an endometriosis tissue showing outlined regions of endometrial glands and stroma that spatially correlate to the distributions of various molecular ions detected by DESI-MS imaging, as exemplified by m/z 303. 233 and m/z 723.478 shown.

