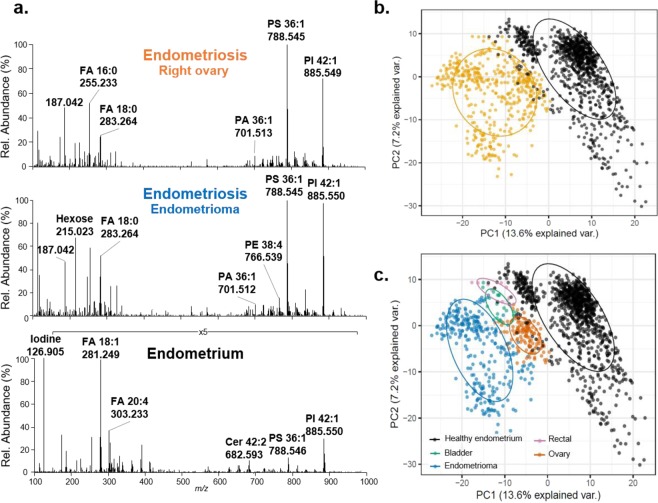
Figure 2.
Intra-patient analysis of eutopic endometrium and four endometriosis tissues collected from ovary, rectal, bladder and endometrioma (patient #98). (a) Selected DESI mass spectra obtained from three samples, including endometriosis from both the right ovary and an ovarian cyst (endometrioma), and eutopic endometrium. (b) PCA score plots of the per-pixel data extracted from all endometriosis tissues (yellow) versus eutopic endometrium tissue (black). (c) PCA results of the per-pixel data extracted from endometriosis tissues per region of excision (ovary in orange; rectal in pink, bladder in green, endometrioma in blue) versus eutopic endometrium tissue (black). Ellipses are calculated by a one-sigma ellipse (68% probability) of an estimated bivariate Gaussian distribution for each group.

