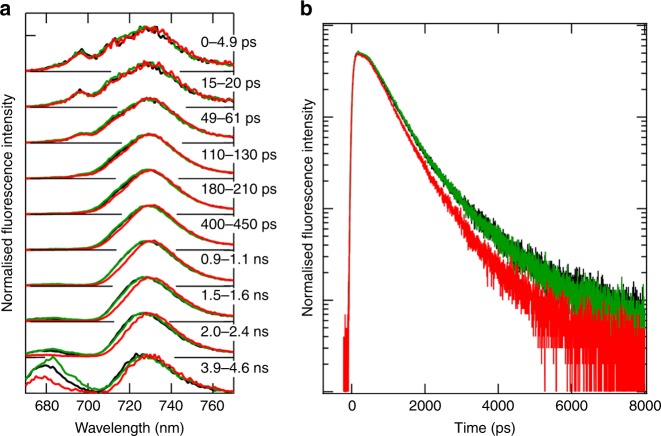
Fig. 5.
TRF analyses of the PSI cores. a TRF spectra measured at 77 K excited at 445 nm. The spectra of the PSI tetramer, dimer and monomer are depicted in red, green and black, respectively, and were normalised by the maximum intensity of each spectrum. b Normalised fluorescence decay curves at 77 K. The decay curves of the PSI tetramer, dimer and monomer are depicted in red, green and black, respectively, and were monitored at 730 nm

