FIGURE 4.

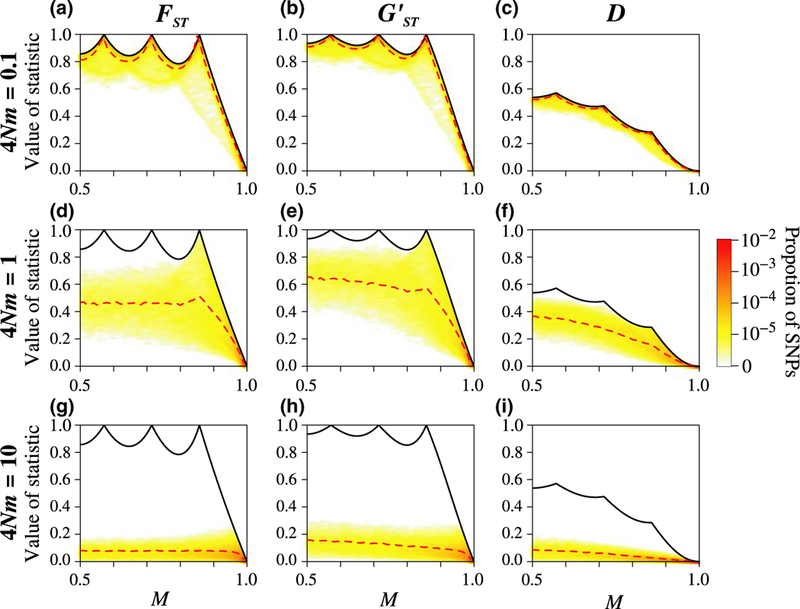
Joint density of the frequency M of the most frequent allele and statistics , , and D, for different scaled migration rates 4Nm, considering K = 7 subpopulations. The simulation procedure and figure design follow Figure 3

Joint density of the frequency M of the most frequent allele and statistics , , and D, for different scaled migration rates 4Nm, considering K = 7 subpopulations. The simulation procedure and figure design follow Figure 3