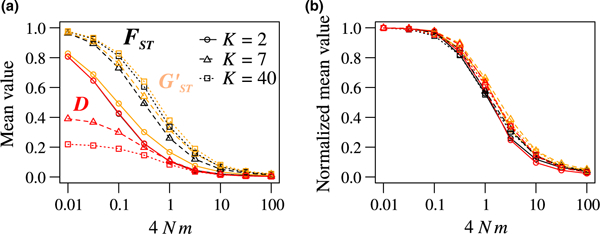
FIGURE 5.

Mean and D across biallelic loci. (a) Unnormalized means and D. (b) Normalized means and the ratio of the mean value to the mean maximal value given the observed frequency M of the most frequent allele. Both plots show quantities as functions of the number of subpopulations K and the scaled migration rate 4Nm. Colours represent the different statistics. Line types represent values of K: 2 (solid), 7 (dashed), and 40 (dotted). Values are computed from coalescent simulations using software ms as in Figure 3, with 1,000 replicate biallelic loci and 100 lineages per subpopulation. and < are respectively computed from equation 11 of Alcala and Rosenberg (2017) and Equations D3 and D4 in Appendix D
